Major Retailers Will Shutter 3,500 Stores in 2019. Here's How Retail Research Can Understand What Comes Next.

Posted by MFour on Mar 19, 2019 6:00:00 AM

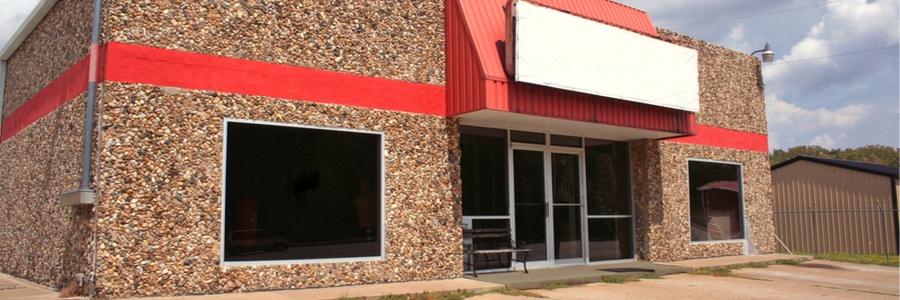
“Where Do Broken Hearts Go?” was a hit ballad for Whitney Houston. “Where do disenfranchised shoppers go?” is an increasingly important question for retail-sector market research as store closures continue to disrupt consumers’ familiar purchase paths. Each round of closures is an inflection point that puts displaced shoppers’ spending and brand loyalty up for grabs.

To win the battle to retain or pry away disenfranchised shoppers after a location closes, brands need fast, reliable data and insights into exactly who has been displaced, where they’re going now, and why they’ve taken that path. The stakes are high, with 3,500 store closings expected this year, according to RetailTouchPoints.

To find, connect with and understand these displaced customers, your best way forward is to combine observational mobile location-visitation data and mobile survey data.

Start with a validated, first-party market research panel that’s large and diverse enough to represent relevant populations of the disenfranchised. Once you’ve taken that crucial step, here are tips on how to proceed.

First challenge: Identify the displaced consumers.

  • Solution: Always-on mobile location tracking records and archives 500,000 daily visits by opted-in consumers to the top 1,000 U.S. retailers, plus an additional 250,000 daily visits to other commercially-significant locations such as entertainment venues and transportation hubs.
  • Result: Researchers quickly identify consumers who have made past visits to now-closed stores and can continue to observe their movements for changes in path-to-purchase patterns. 

Second challenge: Understand where displaced consumers are landing.

  • Solution: Continue always-on tracking of validated disenfranchised shoppers in the weeks or months after a store closure, closely observing for any changes in their brick-and-mortar store-visitation patterns.
  • Result: Obtain location insights into what they do next. 
  • Insights Opportunities:
    • Who remains loyal by switching to another store in the same retail chain?
    • See who’s in play by comparing pre-closure and post-closure visitation patterns. Those who are shopping around are important targets for further inquiry into how they can be influenced.
    • Identify shoppers who have switched loyalties as a result of a store closure and are now shopping mainly or exclusively at a competing store that’s a short distance from the one that closed.
    • See which displaced shoppers have stopped visiting any store in the category. Are they shopping online instead? And at whose eCommerce site?
Third challenge: What’s the “why” behind affected consumers’ observed post-closure visitation patterns? 
  • Solution: Mobile surveys targeted specifically to validated consumers in each behavioral segment - new store, same retailer/switched to a competitor's store after closure/trying different stores/stopped shopping at brick-and-mortar stores in the category. 
  • Result: Useful consumer understanding that helps drive actions and decisions on a number of fronts.
  • Insights Opportunities:
    • The data and insights could inform a variety of marketing efforts, including advertising, discount offers, upgrades of retailers’ apps and online-stores’ attractiveness and functionality to capture dropouts from brick-and-mortar stores.
    • Retailers also can inquire and gain insights into which products and product categories are most important to disenfranchised shoppers as they decide where to go now.

Many other retail problems and opportunities that require fast, trustworthy data will benefit from advanced mobile research solutions. The key inputs that power all these research situations are a large, top-quality, first-party consumer panel that’s engaged and willingly opted in for behavioral tracking as well as surveys.

By coloring observed location data with surveys, and validating the surveys with location data, researchers can gain insights they need to help their brands and clients succeed amid the disruptive changes impacting the retail industry.

Topics: mobile tracking, mobile data, survey data, market research panel, purchase path, always-on data, observational data, retail research

How a Restaurant Chain gets an 80% Completion Rate with its Mobile Tracker on MFourDIY®

Posted by MFour on Jan 28, 2019 6:00:00 AM

What might retail and restaurant brands learn from tens of thousands of first-party U.S. mobile consumers who not only have been GeoValidated® as their customers, but whose profiles fit the specific consumer types the brand considers most important to understand?

Building a custom panel of profiled, known visitors makes it possible to conduct plug-and-play tracking studies in which the questionnaire can be repeated for each wave of customized, non-duplicated consumer panelists.

In one case, a client who customized its audience saved time and money by designing and fielding its own tracking study on MFourDIY®, the only all-mobile DIYsurvey-building platform. The opportunity for accurate segmentation is a key feature: as new members sign up for the consumer panel that participates via MFour’s Surveys On The Go® mobile research app, those who fit the required profiles are automatically funneled into the custom panel, ensuring ongoing representation and consistency for the tracking study. 

Over time, the client in question has seen completion rates of 80%, and drop-off rates under 2% from respondents who fit its consumer profiles and have been geolocated in one of its locations. The tracker focuses on questions about lifestyle and attitudes that impact how its validated customers view eating and health. Among the findings: 

  • 60% of respondents agreed completely or very strongly that “the state of my health is largely in my control." 
  • 25% stated agreed completely or strongly that “I consider myself to be fit and in shape.” 17% said just the opposite. ”
  • Life is hectic out there: 40% of respondents agreed completely or strongly that “I’m always busy and on the go.” Only 8% were completely or strongly certain that “busy and on the go” does not describe their lifestyle. 
  • The accelerated speed of life often dictates decisions about meals: 36% strongly or completely agreed that they opt for speed even though they feel that on-the-go restaurant meals can be unhealthy.
  • Consumers want to fill up when they eat out, with 40% of respondents agreeing strongly or completely that good value depends on “more food for the money.” 
  • At the opposite end of the spectrum, only 7% were convinced that quantity is not essential to good value in restaurant food.
  • When it comes to where the rubber meets the road – or the meal meets the mouth  – a substantial majority of the client's validated customers confessed that they sometimes put pleasure over discipline: the statement, “I love rewarding myself with indulgent food or beverages,” elicited strong or complete agreement from 42% of participants, and an additional 36% said they were “somewhat” in agreement that they love indulging themselves.  
  • Just 9% of respondents indicated a strong or complete rejection of indulging themselves when they eat.To that 9% we can only say, “well, if you’re not going to eat those fries, just pass them over to us.”


Topics: GeoValidation, quick serve restaurants, mobile consumer panel, mobile tracking

21% of Black Friday Shoppers Left Without Buying. Only Mobile Exit Surveys Will Tell You Why

Posted by MFour on Dec 19, 2018 10:26:07 AM


Even on Black Friday, retailers aren’t immune to the problem of non-buying behavior, the frustrating, revenue-sapping phenomenon of being able to entice a consumer into a store, only to have that same consumer leave without buying anything.

Using GPS location tracking, MFour surveyed 3,857 shoppers just as they left five major stores on Black Friday. With their experiences fresh in mind, 21% of the shoppers surveyed said they did not make a purchase during their visit. Identifying non-buyers is the first step toward turning them into spenders, and in-the-moment, right-time and right-place mobile exit surveys are the state of the art for understanding shoppers’ motivations. Just as mobile location surveys enable retailers to understand the “why” behind the buy, the same solution gets to the motivations behind the non-buy.

Depending on the circumstances, the problem could be shortages of popular items, aisle and shelf layouts that make a desired product hard to find, unpopular pricing or inadequate customer service. The problem could be chain-wide and systemic, or a localized issue that would require a local solution. The only way to know is to buttonhole first-party consumers for mobile exit interviews, identify non-buyers, and ask them what the problem was while they’re still at the Point of Emotion®, when their shopping experiences are vivid and fully remembered.

In the Black Friday study, non-buying behavior hit Macy’s and Best Buy shoppers the hardest, with 36% of Macy’s customers and 34% at Best Buy saying they had left without making a purchase. Many respondents said one of their motivations on Black Friday was to see actual items before buying, as an alternative to online shopping. Some are “showroomers” – shoppers who want to see, feel and try on or try out what they’re looking for, but are then willing to keep shopping for a better deal online or at other stores. With their smartphones in hand while they shop a Macy’s or a Best Buy, it takes seconds for shoppers to see whether they can get a better price elsewhere. With reliable data from non-buyers, retailers can gain insights into how to sweeten the experience so that showroomers become willing to buy right now, or commit to buying from the retailer’s own online store.

The Black Friday study showed that shoppers were less likely to leave without buying at Kohl’s (20% non-buyers) and Target (15%). Walmart, which like Target offers daily essentials and snacks and groceries, kept non-buying to 9%.

Even at 15% or 9%, however, retailers are leaving real money on the table. Understanding the “why” behind the non-buy is the first step toward limiting those losses, and GPS-enabled exit surveys of valid, first-party shoppers are the fastest, surest way to get accurate data to guide smart solutions to a problem that persists even on Black Friday, when consumers are intensely motivated to buy.


Topics: consumer insights, mobile, mobile tracking, mobile solutions

Is Market Research Fated To Go the Way of Video Stores?

Posted by MFour on Nov 29, 2018 6:00:00 AM

Blog Video Stores 20Nov18

How important is it to collect fast, accurate data about customer experiences? In one history-making case, a single bad customer experience may have destroyed an industry. 

According to Netflix’s origin myth, company founder Reed Hastings first conceived the idea of a mail-order subscription video service after being slammed with a large late fee because he was tardy in returning a videocassette of the movie, “Apollo 13” to the store he’d rented it from.

You can read this Quartz.com report about how Netflix came to be. While it’s possible that the late-fee incident has been embellished somewhat in its frequent retelling, there’s no question that Hastings wasn’t satisfied with his own video rental experiences and took them as a cue for groundbreaking entrepreneurship. The result has had immense consequences for the distribution and consumption (and more recently, the creation) of video entertainment.

According to estimates from the Digital Entertainment Group, brick-and-mortar video rental stores grossed $393 million in 2017, compared to $11.5 billion for streaming services and video on demand. Meanwhile, the number of video stores fell from nearly 30,000 in 2000 to just over 2,000 in 2017, according to a USA Today feature on America’s fastest-dying industries.

While industries typically can’t trace their collapse to a single failure to provide a satisfying customer experience, poor encounters with brands and retailers inevitably erode their earnings and chase consumers to their competitors. Negative sentiment takes wing in an instant on the internet, and if those perceptions take hold they will threaten revenues and profits.

So staying continually on top of what consumers think and feel about a brand should be a day-by-day priority, verging on an obsession, for market research. Now, thanks to GPS location studies conducted through a mobile research app, it’s an obsession that’s easy to satisfy.

The best time to assess the quality of consumers’ shopping experiences is while the experiences are actually happening, or just after. In-store and after-visit mobile geolocation studies get that job done. Store atmosphere, service quality, pricing, the ease or difficulty shoppers have in navigating the aisles to find the products they want – all can be best assessed at the Point-of-Emotion®. It’s the spot on the place/time continuum where responses from consumers are most vivid and come closest to the whole truth about what they are experiencing, how they feel about it, and how those experiences influence their buying decisions and overall satisfaction.

Of course, GPS location studies will only be as good as who you’re locating and how engaged they are with your research. Unless you want heaps of well-documented trouble associated with the quality of online consumer surveys, the crucial “who” has to be a first-party, single-source consumer panel of validated actual shoppers. MFour’s consumers are gathered around Surveys On The Go®, the most highly-developed, highest-rated mobile research app.

The satisfaction of 2.5 million U.S. consumers who have downloaded SOTG is the big difference maker. They’re engaged, carefully profiled mobile research participants who doubly opt in to have their location journeys tracked, in exchange for increased opportunities to receive surveys they complete quickly on their smartphones. That’s how you’ll identify them in-store and survey them when it matters most.

Expect 25% response rates within an hour, and 50% within 24 hours. And if you want to follow them beyond the moments of shopping and purchasing, and understand their satisfaction at the moment they’re actually using or consuming a product, that’s also an easy “get” for in-app mobile. Expect response rates of 85% for In-Home User Tests conducted up to two weeks after a purchase.

Reed Hastings realized he could transform the movie-rental experience (and the future of rental revenues) by using technology to make it easy on the consumer. You can do the same for yourself. Market research conducted with the state-of-the-art GPS location and consumer-panel quality unique to in-app mobile research will be more satisfying to you as a consumer of market research tools. If the online consumer data you’ve been collecting isn’t giving you what you need, maybe it’s time for some innovative thinking and action of your own.  


Topics: consumer survey, mobile research, geolocation, market research, mobile tracking

See How We Watched Consumers Flock to Starbucks for a Holiday Cup Giveaway

Posted by MFour on Nov 7, 2018 11:47:33 AM

Blog P2P Starbucks giveaway 6Nov18

Three weeks ahead of Black Friday, Starbucks Coffee found itself with its own unique doorbuster on its hands. The coffeehouse giant was offering a free, reusable cup with cheerful holiday designs featuring the Starbucks logo to any customer who came in on Friday, Nov. 2 and ordered one of Starbucks’ special seasonal coffee drinks.

The result? A whopping 41% spike in foot traffic over the average Friday. There was even an apparent echo effect: on Saturday, Nov. 3, the day after the one-day offer, foot traffic was 16% greater than the average Saturday.

Market researchers interested in gaining insights into coffeehouse chains and quick-serve restaurants can see the spike in foot traffic for themselves in chart form on MFour’s Path-2-Purchase® Platform. Plug in “Starbucks” on the free Path-2-Purchase tracking tool, and you’ll see the big surge that occurred on Nov. 2-3, and how visits on the day of the cup giveaway compared to every other day in the preceding three months.

Path-2-Purchase is unique in its ability to track validated, representative U.S. consumers’ visits to 12.5 million locations, including all of the top 1,000 retail and restaurant chains. On the technology side it’s powered by advanced GPS location technology and MFour’s unrivaled Surveys On The Go® (SOTG) mobile research app. On the people side, SOTG gives researchers the ability to connect with the 2.5 million first-party consumers who have downloaded the app.

SOTG users give double opt-in consent to have their movements tracked using their smartphones’ GPS features, in exchange for opportunities to receive location-specific surveys that earn them cash rewards. It’s these demographically profiled consumers’ engagement with SOTG that makes it possible for marketers and market researchers to see where they go, when and how often – and to gain otherwise unobtainable insights into events such as the Starbucks cup giveaway.

Tracking is only a means to the most productive research end: connecting with the consumers you’ve tracked to survey them about the experiences they’ve had at any stop along their paths to purchase. For example, a researcher interested in the competition in coffee could use Path-2-Purchase data to identify validated Starbucks customers and send them surveys. You also could overlay Starbucks and Dunkin’ Donuts locations to compare visitation and identify important consumer segments. Segments might include coffee-agnostics who go to both Starbucks and Dunkin’ Donuts, or loyalists who are customers of one but never the other.

Once you've identified your segments, you can survey those consumers to understand the all-import “why” behind their coffee buy.

We know there's no shortage of GPS visitation tracking providers, but all the rest are only capable of counting footprints and spitting out numbers. The location data they give you ends there, leaving the actual consumers who've left those footprints all but invisible.

But when you conduct location-based mobile research using Surveys On The Go, the validated, first-party consumers you track are profiled, real and reachable, so you can connect with them for the "why" behind the buy.

As it turned out, Dunkin’ Donuts managed to hold its own during Starbucks’ big Friday cup giveaway: nationwide, its traffic fell just 1% below the Friday average.  

In fact, Starbucks’ cup giveaway actually turned out to be a little too successful. The Today Show reported on its website that supplies quickly ran out at some locations, leaving customers disappointed. 

If you’re so inclined, we can identify and put you in touch with members of the SOTG consumer panel who went to a Starbucks on Nov. 2 (or on any other day). Ask them about their experiences with the special giveaway. Are they in love with their free cups? Are they miffed because the Starbucks they went to had run out? Did they try one of the special holiday brews? Was it delish or just so-so? And how did the cup giveaway impact their overall satisfaction with the Starbucks brand?

When it comes to coffee, or anything else in the consumer realm, Path-2-Purchase® Platform gives you a heaping, caffeinated cup of quick-turnaround research you can’t accomplish anywhere else.

Topics: geolocation, market research, Path-2-Purchase™ Platform, consumer panel, mobile tracking, foot traffic

Subscribe to Email Updates

Recent Posts