Nearly 30% of Americans Ages 21-64 Say They've Filled in NCAA Basketball Tournament Brackets, and One in Seven Has Placed a Bet

Posted by MFour on Mar 27, 2019 11:08:35 AM

Nearly 30% of 21- to 64-year-olds who responded to a survey by MFour Mobile Research said they have filled in a tournament bracket for the NCAA men’s basketball championships, and 14% are betting on the annual March sports ritual.

The study surveyed 4,200 U.S. residents nationwide, including 1,800 NCAA basketball tournament fans and 2,400 non-fans. Fans were defined as those who said they’re planning to watch the tournament.

Betting Behavior

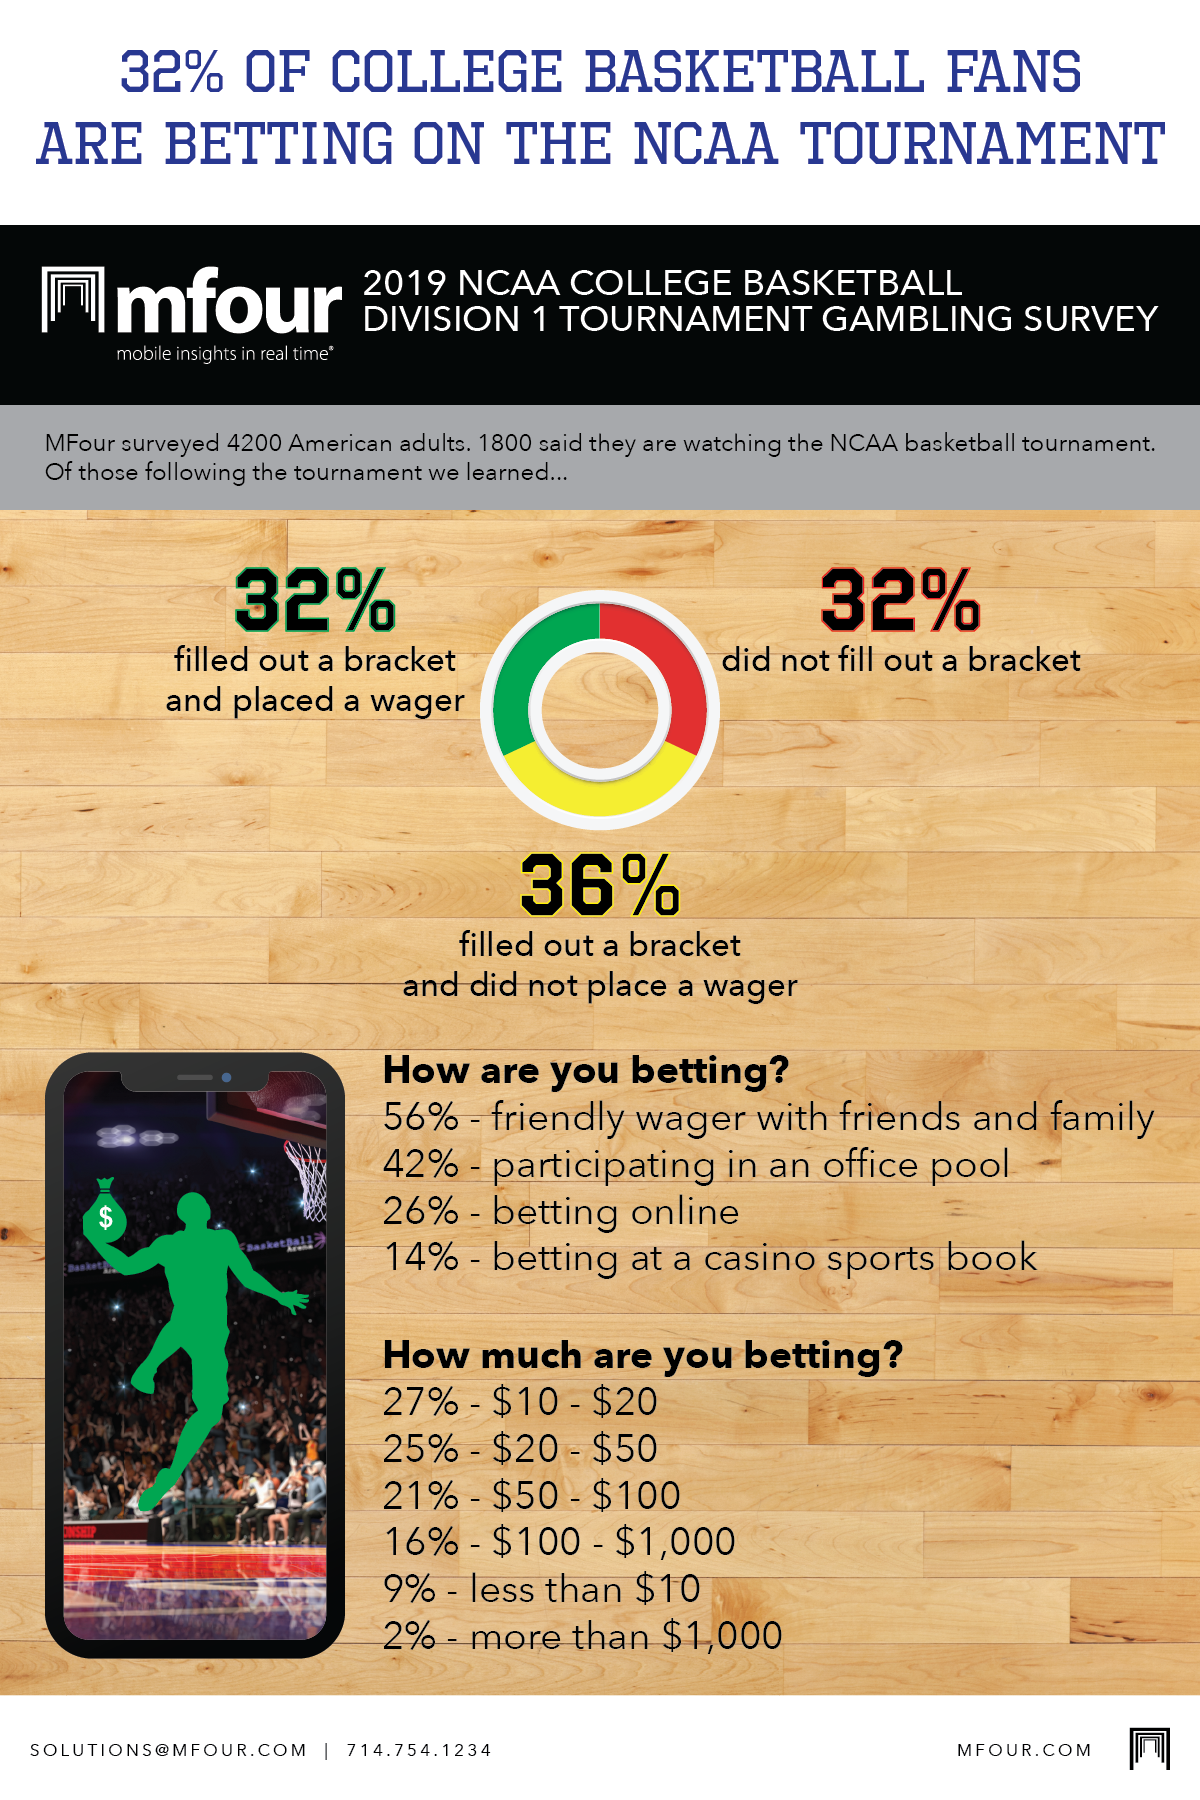
  • Among those watching the tournament, 32% said they’re also betting.
  • Among those who said they’re betting, 26% reported using online betting services.
  • 14% of bettors said they’ll place wagers in person at a casino sports books.
  • 56% of those making bets said they were informal wagers with family or friends.
  • 68% of people watching the games said they had filled out a tournament bracket.
  • But 53% of bracket-players said it was just for fun, no money involved.

 Amounts Wagered

  • 18% of bettors surveyed expected to wager $100 or more.
  • 21% said they would bet $50 to $99.
  • 25% planned to wager $20 to $49.
  • 37% said they would wager less than $20.

Viewing characteristics:

  • 17% of tournament-watchers said they’d be watching at work.
  • 67% of at-work watchers said it’s OK with their supervisors.
  • 33% said it’s against the rules, but they’ll watch at work anyway and try not to get caught.
  • Of those with permission to watch in the workplace, 56% will do it on a shared office TV screen.

Methodology:

The eight-question survey was fielded March 21-24 to U.S. consumers ages 21 to 64. All respondents use Surveys On The Go®, MFour’s mobile market research app, to take surveys on their smartphones or tablets. MFour received initial responses from 4,214 consumers who were representative by region. To indicate interest in the tournament, they were initially asked whether they planned to watch tournament games. The 1,810 respondents who indicated they were watching the tournament went on to complete the survey, providing answers about their plans for wagering and viewing.
mfour-2019-ncaa-basketball-survey-on-betting-infographic


Topics: market research, surveys, market research panel, sports betting, NCAA basketball tournament

Major Retailers Will Shutter 3,500 Stores in 2019. Here's How Retail Research Can Understand What Comes Next.

Posted by MFour on Mar 19, 2019 6:00:00 AM

“Where Do Broken Hearts Go?” was a hit ballad for Whitney Houston. “Where do disenfranchised shoppers go?” is an increasingly important question for retail-sector market research as store closures continue to disrupt consumers’ familiar purchase paths. Each round of closures is an inflection point that puts displaced shoppers’ spending and brand loyalty up for grabs.

To win the battle to retain or pry away disenfranchised shoppers after a location closes, brands need fast, reliable data and insights into exactly who has been displaced, where they’re going now, and why they’ve taken that path. The stakes are high, with 3,500 store closings expected this year, according to RetailTouchPoints.

To find, connect with and understand these displaced customers, your best way forward is to combine observational mobile location-visitation data and mobile survey data.

Start with a validated, first-party market research panel that’s large and diverse enough to represent relevant populations of the disenfranchised. Once you’ve taken that crucial step, here are tips on how to proceed.

First challenge: Identify the displaced consumers.

  • Solution: Always-on mobile location tracking records and archives 500,000 daily visits by opted-in consumers to the top 1,000 U.S. retailers, plus an additional 250,000 daily visits to other commercially-significant locations such as entertainment venues and transportation hubs.
  • Result: Researchers quickly identify consumers who have made past visits to now-closed stores and can continue to observe their movements for changes in path-to-purchase patterns. 

Second challenge: Understand where displaced consumers are landing.

  • Solution: Continue always-on tracking of validated disenfranchised shoppers in the weeks or months after a store closure, closely observing for any changes in their brick-and-mortar store-visitation patterns.
  • Result: Obtain location insights into what they do next. 
  • Insights Opportunities:
    • Who remains loyal by switching to another store in the same retail chain?
    • See who’s in play by comparing pre-closure and post-closure visitation patterns. Those who are shopping around are important targets for further inquiry into how they can be influenced.
    • Identify shoppers who have switched loyalties as a result of a store closure and are now shopping mainly or exclusively at a competing store that’s a short distance from the one that closed.
    • See which displaced shoppers have stopped visiting any store in the category. Are they shopping online instead? And at whose eCommerce site?
Third challenge: What’s the “why” behind affected consumers’ observed post-closure visitation patterns? 
  • Solution: Mobile surveys targeted specifically to validated consumers in each behavioral segment - new store, same retailer/switched to a competitor's store after closure/trying different stores/stopped shopping at brick-and-mortar stores in the category. 
  • Result: Useful consumer understanding that helps drive actions and decisions on a number of fronts.
  • Insights Opportunities:
    • The data and insights could inform a variety of marketing efforts, including advertising, discount offers, upgrades of retailers’ apps and online-stores’ attractiveness and functionality to capture dropouts from brick-and-mortar stores.
    • Retailers also can inquire and gain insights into which products and product categories are most important to disenfranchised shoppers as they decide where to go now.

Many other retail problems and opportunities that require fast, trustworthy data will benefit from advanced mobile research solutions. The key inputs that power all these research situations are a large, top-quality, first-party consumer panel that’s engaged and willingly opted in for behavioral tracking as well as surveys.

By coloring observed location data with surveys, and validating the surveys with location data, researchers can gain insights they need to help their brands and clients succeed amid the disruptive changes impacting the retail industry.

Topics: mobile tracking, mobile data, survey data, market research panel, purchase path, always-on data, observational data, retail research

MFour's Partnership with IRI Results in New Insights on Cannabis Users

Posted by MFour on Mar 13, 2019 9:44:59 AM

MFour partnered with leading research firm IRI for IRI’s “New Cannabis Attitude and Usage Study,” surveying legal adult cannabis users to understand their attitudes and motivations, and what further legalization might mean in the marketplace. Among the key findings:

  • Cannabis consumers defy stereotypes.
  • Cannabis products replace purchases of over-the-counter medications.
  • But snack-food manufacturers stand to benefit as legalization spreads.

To read IRI’s press release announcing the cannabis study’s results, click here.

Related: IRI and MFour Partner To Launch IRI OnSights™

Topics: consumer survey, mobile market research, market research panel, IRI Partnership

What Does Digital Advertising Need Most? Effectiveness Metrics from a Mobile Consumer Panel

Posted by MFour on Feb 28, 2019 8:00:00 AM

Digital is dominating the advertising industry, and ad effectiveness measurement with an all-mobile consumer panel gathered around a mobile market research app is the necessary solution for understanding how well $129 billion in projected 2019 spending is performing as brands try to influence smartphone-centric consumers.

eMarketer predicts 2019 will be the milestone year in which U.S. advertisers for the first time spend more on digital ads ($129 billion) than on television, radio and all other “traditional” advertising channels combined ($109 billion) as they seek to exert influence all along the purchase path. Mobile digital ads will account for $87 billion – 67% of all digital spending, and 36% of all ad-spend dollars across all channels.

It goes without saying that documenting the effectiveness of all those digital advertising dollars is a crucial job for market research. But that task has been deeply problematic, with standard  measurement methods unable to collect reliable metrics in the digital realm. With that in mind, MFour recently announced a comprehensive solution driven by feedback from validated digital ad recipients from the 2.5 million member, all-mobile U.S. consumer panel that uses the Surveys On The Go® mobile market research app.

As Chris St. Hilaire, MFour’s co-founder and CEO has framed it, “until now, digital ad measurement has been directional at best, focused on desktops rather than smartphones despite consumers' massive shift to mobile. Brands are shifting ad spend to mobile because they know that’s where consumers are. Digital Brand Studies don't just guess. They provide accurate, validated metrics. Measuring ad effectiveness doesn’t have to be like reading tea leaves any more.”

For more on Digital Brand Studies, just click here.


Topics: mobile market research, digital advertising, mobile consumer panel, Digital Brand Studies, market research panel

Subscribe to Email Updates

Recent Posts