Case Study: Tackling the Mystery of the Non-Buyer with Mobile GeoIntercepts

Posted by MFour on Sep 5, 2018 9:17:40 AM

Blog Intercepts 4Sept18

Football season is back (yessss!!), and with it comes a tip for consumer insights pros: one of the key performance indicators for a market research team’s success is how well it can intercept consumers during their natural buying journeys.

In the NFL, interceptions are often game-changers, and it takes a rare combination of talent and skill to intercept. The key attributes are quickness and anticipation, and an uncanny knack for being in just the right position when the ball is in the air.

Quickness and being in the right place at the right time are also crucial to collecting quality consumer data that will give decision-making stakeholders the field position they need to advance their companies’ or brands’ marketing and sales goals.

In theory, retailers can get reliable (albeit seldom timely) data on what’s actually being bought. But they get no real insight into customers' motivations – the "why" behind the "what." The problem becomes exponentially harder when the subject is non-buying behavior. Who entered a store but failed to buy everything they’d intended to purchase? What did they not buy? Why did it happen, and how much revenue did the store leave on the table?

The answers, and the ability to defend against non-buying, won’t be forthcoming unless customer experience research teams learn how to intercept.

There’s no better way to collect premium data than by intercepting it from consumers naturally, and in real time, as they go about their daily buying journeys. So in the spirit of NFL players poring over game film to get a competitive edge, let’s look at a case study that illustrates how natural intercepts work.

The Problem: Researchers for a leading retail chain that does a huge volume in CPG sales were trying to tackle one of their business’s most frustrating problems: losing revenue because many customers who entered a store didn't buy everything they had intended to purchase.

The Answer: For the retail chain in question, all it took was a discussion with MFour reps about GeoValidation® – a proprietary capability driven by the advanced GPS technology embedded in the Surveys on the Go® research app. Clients track app-using U.S. consumers’ movements and verify when they arrive and then leave a location of research interest.

  • In this case, all members of MFour’s first-party consumer panel who entered one of the client’s stores were located on arrival, and received a push notification of a survey opportunity upon departure.
  • When they responded – with a 25% response rate within an hour and 50% within 24 hours – the process of intercept followed by data return was complete.
  • Qualifiers for the study were 400 consumers nationwide, who said they had not purchased everything they had intended to buy.
  • In beauty products, 31% of non-purchasers cited price as the factor that discouraged them from buying; 37% said they had simply been unable to find the item they wanted, or that it was not available.
  • For shoppers looking for personal care products, 31% cited price and 28% cited unavailability or inability to find the intended item.
  • Among candy and snack intenders, 20% said they didn’t buy because of pricing, and 24% because what they wanted wasn’t there or couldn’t be found.
  • Among grocery and beverage shoppers who said they had left without an item they had arrived intending to purchase, 44% cited price and 24% said items were not available or couldn’t be found.
  • Asked whether they were satisfied with their overall shopping experience, 57% of non-buyers rated their visit as an 8 or a 9 on a nine-point satisfaction scale. 24% graded their experience in the poor to middling range (1 to 6 on the scale).

The study gave the client clarity on factors that were costing it millions in revenue each day nationwide, and potentially alienating many customers. The previously unobtainable data from natural intercepts gave researchers their first clearly-informed look at the problem, so they could recommend a game plan to win back the sales and revenue that the chain’s stores were letting slide through their hands.

For an informative and productive conversation about how to program natural intercepts into your research game plan, just click here.

Topics: non-buyers, location based survey, geolocation, market research, consumer insights, retail, in-store, GeoValidation

Taking the Fear Out of Halloween Consumer Research

Posted by MFour on Aug 30, 2018 6:00:00 AM

Blog Halloween early bird 29aug18  

Have you ramped up your market research yet for Halloween? Trick or treating commences in just two months, so it’s time to review whether you’re equipped with solutions for harvesting accurate, reliable and representative consumer insights on candy and costumes, pumpkins and decorations, and the season’s scary movies. After all, quoth the Raven, the early bird gets the revenue.

  • The National Retail Federation estimated that 179 million Americans of all ages celebrated Halloween in 2017, spending $9.1 billion, or $86 per household. And 30% of those the NRF surveyed said they had begun their Halloween shopping in September, with an additional 6% starting even earlier.
  • The NRF estimated last year that about 37% of consumers expected to do their shopping at a Halloween specialty store, second only to discount stores (47%) and ahead of grocery stores (25%) and online shopping (22%).
  • The NRF study found that 35% of consumers planned to search online to get ideas for their Halloween purchases and celebrations. 30% would do reconnaissance in-store, and that 10% to 18% would look for ideas on social media, depending on the platform.

With those stakes in mind, here are some ideas for marketers and market researchers who are gearing up to collect consumer insights leading up to Halloween.

In-Store Shopper Experience and Satisfaction (Have You Been Tricked?)

Your research data will be nothing but empty calories If you rely on stated answers from surveys taken days or weeks after a shopping experience. In market research, recall bias spoils the candy, producing dubious data that’s unfit for consumption by your stakeholders and clients. Here are some of the questions for which you need consumers to answer with certainty, not guesses.

  • Are Halloween product displays at groceries, party-supply stores and crafts stores capturing shoppers’ attention?
  • Are displays and promotions having the desired, in-the-moment effect by driving spending from in-store consumers who hadn’t even intended to make any Halloween purchases?
  • Is the holiday candy aisle enticing shoppers? Or is it a mess that makes it hard for them to find what they want?

Now Here's Your Treat

In-store and after-visit mobile location studies are the way to go to understand the shopper experience. It’s the only cost-effective way to know what’s driving them at the Point-of-Emotion® where buying decisions are made.

  • Follow your audience into a store by using mobile geolocation. Survey them right there, or wait until just after they’ve left. In either case, the data is fast, fresh and free from recall bias.
  • Mobile respondents also will use their phones to create stills and videos on the spot, showing you exactly what they see while they tell you exactly what they think about displays, placement, service quality, store environment, and whatever else you need -- including whether you’ve stocked big enough pumpkins.
  • Media captures also give you ironclad validation of visits and purchases. When already validated members of a first-party consumer panel photograph purchase receipts or store displays, there can be no doubt as to data quality.

Advertising Effectiveness (Have You Been Tricked?)

Advertisers and agencies suffer frustration year-round when it comes to finding real, dependable metrics for awareness, lift, and attribution across all media.

  • The lack of actual data from real, ad-exposed consumers is downright scary for anyone who has an advertising budget to allocate.
  • Until now, there’s been no choice but to resort to voodoo: trying to dress up location data from unvalidated consumers by adding mere inferences about who they might be. Algorithms that sift through third-party data spit out a profile, but can you trust it? You need actual data from known, first-party consumers.

Now Here's Your Treat:

Intelligent-OOH™ is the new market research product that finally provides a way to talk with real, first-party consumer panel members who actually have been exposed to out-of-home advertising.

  • First you validate their exposure via advanced mobile geolocation.
  • Then you survey them to understand how well the OOH campaign has succeeded.
  • Ascertain their brand and product awareness versus an unexposed control group.
  • Learn whether they intend to buy.
  • Then track their subsequent location visits and send a survey after they’ve been to a store that carries the advertised product. Do they cite the billboard or other OOH signage when you ask why they bought a product?

Entertainment Industry (Have You Been Tricked?)

Halloween is synonymous with horror at the multiplex, but theater chains need to be sure their customers are experiencing movies as a treat. There has been no good way to get reliable data on how moviegoers view their experiences with concessions, lobby displays and on-screen advertising. To get people into those seats, film studios need to create effective trailers, and test them on the target audience for each film.

Now Here's Your Treat:

  • In-store and after-visit location studies put cinema owners in touch with validated moviegoers, for fast insights into their experience of the movie and of the theater’s amenities. If something’s not right on opening weekend, you’ll correct it by the next.
  • MFour is the acknowledged leader in mobile film-trailer and television episode testing.
  • Special smartphone technology enables entertainment clients to show clips or entire trailers on the same smartphones most consumers use to scout movies and decide which ones to see.
  • Security is crucial in trailer testing, and MFour’s system prevents respondents from downloading or sharing test images or video clips. In other words, no unauthorized spoilers.

Whether your research needs are in advertising effectiveness, shopper experience, or path to purchase, let’s talk about how mobile research solutions can satisfy your projects’ specific needs. Just click here.


Topics: mobile research, geolocation, market research, consumer insights, Halloween, in-store

It's a War Out There: Consumer Insights and the Battle for QSR Pizza Market Share

Posted by MFour on Jul 27, 2018 7:00:00 AM

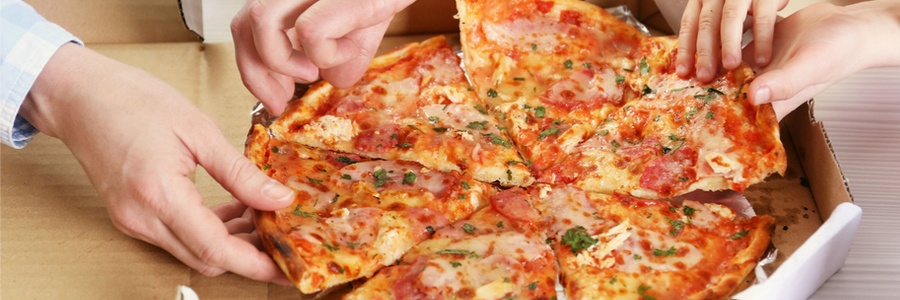
 Pizza Blog 26July18

From a business perspective, a key ingredient for success in the battle for market share in quick-serve pizza delivery and carryout is validated consumer insights from real pizza buyers.

The war for the pizza consumer’s wallet is extremely hard-fought, the latest evidence being Domino’s announcement that it aims to open 2,350 additional stores in the U.S. over the next ten years – a 42% increase from the 5,650 locations it already has. Now that’s an ambitious example of a business trying to increase its deliverables. Right now, however, Pizza Hut is in the lead, with 7,469 U.S. stores at the start of 2018.

Fast delivery is not the only thing QSR pizza brands must deliver. They need excellent counter service, too. Domino’s for example, realized 63% of its $26.5 billion in 2017 U.S. sales from carryout business, per its most recent annual report.

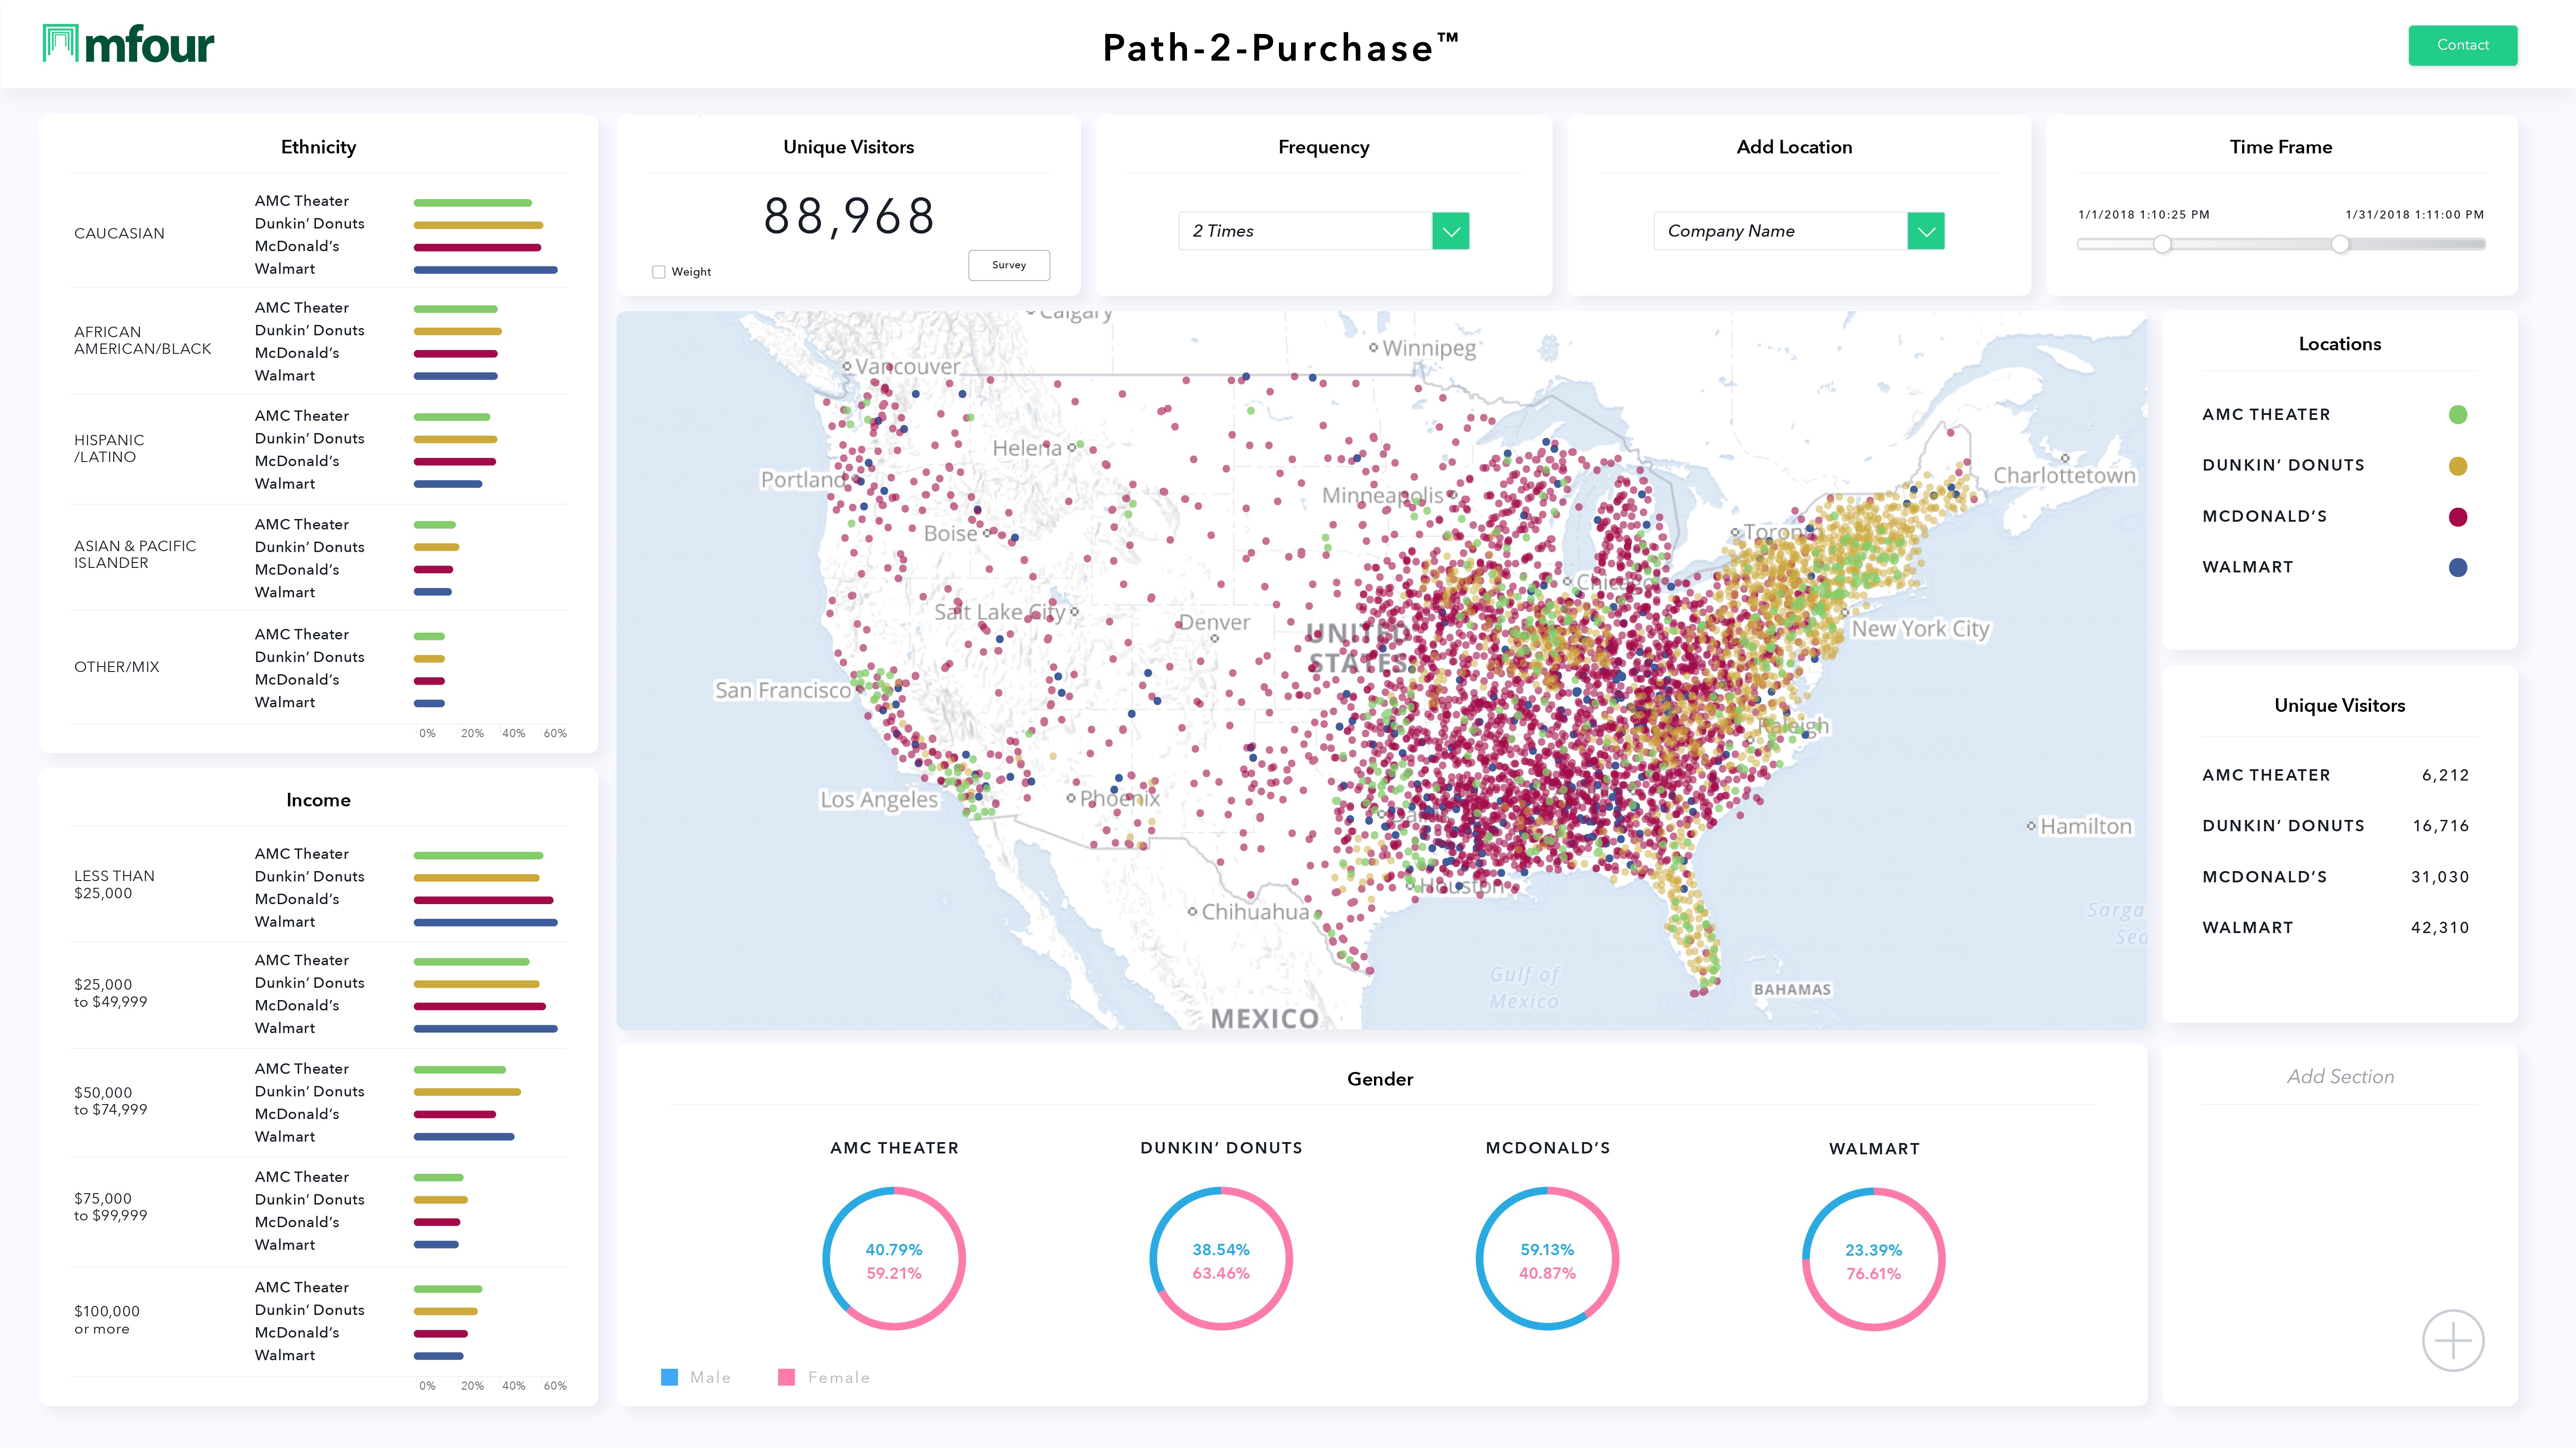
From a marketing and consumer insights perspective, Domino’s, Pizza Hut, and every other QSR pizza or fast-casual pizza chain has at least one thing in common: it’s easy to find out who’s going to each brand’s stores for carryout or dining in, and how much traffic each chain is getting, down to individual stores. You just have to know about MFour’s Path-2-Purchase™ Platform, which you can do by clicking right here.

Important consumer panel facts and mobile research capabilities include:

  • 2 million validated, demographically-profiled real consumers who have downloaded the Surveys On The Go® mobile research app.
  • Store-level accuracy with GPS location tech that tracks and validates each research participant’s store visits across 12.5 million U.S. retail and restaurant locations (including all stores of the top 1,000 retailers, with all the big pizza players represented).
  • Identify key consumer segments to understand the “who” behind those location visits – segment by age, sex, income or whatever else you need, with 250 demographic and ethnographic profiling characteristics.
  • Add the “where” of consumer behavior by observing real, first-party participants’ visits to store locations in a specific zip code, in a DMA, a state, or nationwide.
  • Understand the “when” and the “how often” by observing visit frequency (indicating who’s a brand loyalist, agnostic, or rejector), time of day, day of week, and dwell-time.
  • Crucially, get insights into the “why,” by surveying GeoValidated® consumers after they’ve left a store. Expect a 25% response rate within an hour, 50% within 24 hours.
  • Get competitive insights by identifying, tracking and surveying a rival’s customers.

There’s a lot more – for example, we can help you find and survey pizza delivery workers, too. And another Domino’s initiative, delivering to 200,000 outdoor locations nationwide, such as beaches and parks, can be observed and studied too, via custom geolocation research that captures visits to any place in the U.S. for which you know the latitude and longitude. You can set up a productive personal demo on how to find, reach out to and understand the real consumers most important to your specific research projects and objectives, just by clicking here.


Topics: geolocation, market research, Path-2-Purchase™ Platform, consumer insights, QSR, competitive insights

How To Fight Recall Bias in Consumer Insights

Posted by MFour on Apr 24, 2018 9:50:25 AM

P2P_Dashboard_widescreen_update_Final

 It’s often said that memories make life worth living. But in consumer insights, too often they make life a headache.

Yes, we’re talking about recall bias, which is the error that occurs when survey respondents give answers based on faulty recall. It’s a harsh reality that while memories are made to be cherished, the reason we cherish them is because they are so easily lost. And in market research, data infected by recall bias compromises everything.

As the authors of a 2017 scholarly study examining recall bias put it, “simple…recall questions generate large measurement errors.” The study focused on a survey by the Canadian government in which respondents were asked how much they had spent on food over the previous four weeks. The answers consistently underestimated actual expenditures, compared to data from subsequent diary studies involving the very same respondents (the authors noted that the diary phase was considered more reliable, but had accuracy problems of its own because of data-distorting factors such as respondents growing tired of having to record expenses each day).

The good news is there’s now an almost surefire remedy for recall bias in consumer research. But first, let’s dig a bit deeper into the problem, by asking you to take a very quick survey.

  • How often have you eaten quick-serve restaurant food in the past two weeks?
  • How many times have you stopped for gas over the past four weeks?

  • When did you last pass by a billboard for [fill in the name of the brand or product]? 
  • Do you like being asked questions you can’t properly answer?

That last one is rhetorical and perhaps a bit facetious. But the fact is, recall-based research happens all the time, and it puts insights professionals in the uncomfortable position of having to present recommendations to decision-makers that the researchers know are tainted by recall bias. Until now there has been no reliable and affordable alternative, except to accept recall bias as a fact of life and hope it doesn't distort data too badly.

But now there is.

Users of the new Path-2-Purchase™ Platform are putting recall bias behind them. They’re targeting mobile consumers by leveraging smartphones’ GPS features to find real people in real time and in the most relevant places, for in-the-moment, Point-of-Emotion® research. Instead of asking about experiences from a week ago, they’re getting insights into what their consumers just did – or are doing right now – along with vivid and trustworthy feedback on why they’re doing it and how it makes them feel.

It’s also important to note that with Path-2-Purchase™ you don’t have to even ask a question to learn how many times a consumer has been to a gas station or a quick serve restaurant over the past two or four weeks. Respondents opt in for location tracking that automatically tells you where, when, how often and for how long they’ve been in a given location. You can use that information to build a perfectly-tailored questionnaire. You also can track whether they’ve come in view of your brand’s billboards.

Early adopters of Path-2-Purchase™ Platform are beating recall bias at last, and so will you. For a one-on-one demo of how it can fill your projects' specific needs, just click here.

Topics: geolocation, Path-2-Purchase™ Platform, consumer insights

1,000 Fast Food Diners in One Day

Posted by admin on Sep 7, 2016 7:46:53 AM
To find out how you can reach fast food customers (or any other chain store shoppers) before they've even left the parking lot, tune in Wednesday, Sept. 21 at 12 noon, Pacific, for "After-Visit Evaluation: Insights When They're Fresh." It's the next webinar on how to use MFourDIY, the only all-mobile, do-it-yourself survey-building platform.
 
Sign up below for any upcoming 30-minute session.
Wednesday, September 21, 12 p.m., Pacific
Wednesday, October 19, 12 p.m., Pacific
Wednesday, November 16, 12 p.m., Pacific
Also, we've posted previous webinars on  YouTube.

Topics: MFour Mobile Research, fast food, max, after-visit, MFour Blog, mobile, geolocation

Subscribe to Email Updates

Recent Posts