Case Study: Tackling the Mystery of the Non-Buyer with Mobile GeoIntercepts

Posted by MFour on Sep 5, 2018 9:17:40 AM

Blog Intercepts 4Sept18

Football season is back (yessss!!), and with it comes a tip for consumer insights pros: one of the key performance indicators for a market research team’s success is how well it can intercept consumers during their natural buying journeys.

In the NFL, interceptions are often game-changers, and it takes a rare combination of talent and skill to intercept. The key attributes are quickness and anticipation, and an uncanny knack for being in just the right position when the ball is in the air.

Quickness and being in the right place at the right time are also crucial to collecting quality consumer data that will give decision-making stakeholders the field position they need to advance their companies’ or brands’ marketing and sales goals.

In theory, retailers can get reliable (albeit seldom timely) data on what’s actually being bought. But they get no real insight into customers' motivations – the "why" behind the "what." The problem becomes exponentially harder when the subject is non-buying behavior. Who entered a store but failed to buy everything they’d intended to purchase? What did they not buy? Why did it happen, and how much revenue did the store leave on the table?

The answers, and the ability to defend against non-buying, won’t be forthcoming unless customer experience research teams learn how to intercept.

There’s no better way to collect premium data than by intercepting it from consumers naturally, and in real time, as they go about their daily buying journeys. So in the spirit of NFL players poring over game film to get a competitive edge, let’s look at a case study that illustrates how natural intercepts work.

The Problem: Researchers for a leading retail chain that does a huge volume in CPG sales were trying to tackle one of their business’s most frustrating problems: losing revenue because many customers who entered a store didn't buy everything they had intended to purchase.

The Answer: For the retail chain in question, all it took was a discussion with MFour reps about GeoValidation® – a proprietary capability driven by the advanced GPS technology embedded in the Surveys on the Go® research app. Clients track app-using U.S. consumers’ movements and verify when they arrive and then leave a location of research interest.

  • In this case, all members of MFour’s first-party consumer panel who entered one of the client’s stores were located on arrival, and received a push notification of a survey opportunity upon departure.
  • When they responded – with a 25% response rate within an hour and 50% within 24 hours – the process of intercept followed by data return was complete.
  • Qualifiers for the study were 400 consumers nationwide, who said they had not purchased everything they had intended to buy.
  • In beauty products, 31% of non-purchasers cited price as the factor that discouraged them from buying; 37% said they had simply been unable to find the item they wanted, or that it was not available.
  • For shoppers looking for personal care products, 31% cited price and 28% cited unavailability or inability to find the intended item.
  • Among candy and snack intenders, 20% said they didn’t buy because of pricing, and 24% because what they wanted wasn’t there or couldn’t be found.
  • Among grocery and beverage shoppers who said they had left without an item they had arrived intending to purchase, 44% cited price and 24% said items were not available or couldn’t be found.
  • Asked whether they were satisfied with their overall shopping experience, 57% of non-buyers rated their visit as an 8 or a 9 on a nine-point satisfaction scale. 24% graded their experience in the poor to middling range (1 to 6 on the scale).

The study gave the client clarity on factors that were costing it millions in revenue each day nationwide, and potentially alienating many customers. The previously unobtainable data from natural intercepts gave researchers their first clearly-informed look at the problem, so they could recommend a game plan to win back the sales and revenue that the chain’s stores were letting slide through their hands.

For an informative and productive conversation about how to program natural intercepts into your research game plan, just click here.

Topics: non-buyers, location based survey, geolocation, market research, consumer insights, retail, in-store, GeoValidation

Taking the Fear Out of Halloween Consumer Research

Posted by MFour on Aug 30, 2018 6:00:00 AM

Blog Halloween early bird 29aug18  

Have you ramped up your market research yet for Halloween? Trick or treating commences in just two months, so it’s time to review whether you’re equipped with solutions for harvesting accurate, reliable and representative consumer insights on candy and costumes, pumpkins and decorations, and the season’s scary movies. After all, quoth the Raven, the early bird gets the revenue.

  • The National Retail Federation estimated that 179 million Americans of all ages celebrated Halloween in 2017, spending $9.1 billion, or $86 per household. And 30% of those the NRF surveyed said they had begun their Halloween shopping in September, with an additional 6% starting even earlier.
  • The NRF estimated last year that about 37% of consumers expected to do their shopping at a Halloween specialty store, second only to discount stores (47%) and ahead of grocery stores (25%) and online shopping (22%).
  • The NRF study found that 35% of consumers planned to search online to get ideas for their Halloween purchases and celebrations. 30% would do reconnaissance in-store, and that 10% to 18% would look for ideas on social media, depending on the platform.

With those stakes in mind, here are some ideas for marketers and market researchers who are gearing up to collect consumer insights leading up to Halloween.

In-Store Shopper Experience and Satisfaction (Have You Been Tricked?)

Your research data will be nothing but empty calories If you rely on stated answers from surveys taken days or weeks after a shopping experience. In market research, recall bias spoils the candy, producing dubious data that’s unfit for consumption by your stakeholders and clients. Here are some of the questions for which you need consumers to answer with certainty, not guesses.

  • Are Halloween product displays at groceries, party-supply stores and crafts stores capturing shoppers’ attention?
  • Are displays and promotions having the desired, in-the-moment effect by driving spending from in-store consumers who hadn’t even intended to make any Halloween purchases?
  • Is the holiday candy aisle enticing shoppers? Or is it a mess that makes it hard for them to find what they want?

Now Here's Your Treat

In-store and after-visit mobile location studies are the way to go to understand the shopper experience. It’s the only cost-effective way to know what’s driving them at the Point-of-Emotion® where buying decisions are made.

  • Follow your audience into a store by using mobile geolocation. Survey them right there, or wait until just after they’ve left. In either case, the data is fast, fresh and free from recall bias.
  • Mobile respondents also will use their phones to create stills and videos on the spot, showing you exactly what they see while they tell you exactly what they think about displays, placement, service quality, store environment, and whatever else you need -- including whether you’ve stocked big enough pumpkins.
  • Media captures also give you ironclad validation of visits and purchases. When already validated members of a first-party consumer panel photograph purchase receipts or store displays, there can be no doubt as to data quality.

Advertising Effectiveness (Have You Been Tricked?)

Advertisers and agencies suffer frustration year-round when it comes to finding real, dependable metrics for awareness, lift, and attribution across all media.

  • The lack of actual data from real, ad-exposed consumers is downright scary for anyone who has an advertising budget to allocate.
  • Until now, there’s been no choice but to resort to voodoo: trying to dress up location data from unvalidated consumers by adding mere inferences about who they might be. Algorithms that sift through third-party data spit out a profile, but can you trust it? You need actual data from known, first-party consumers.

Now Here's Your Treat:

Intelligent-OOH™ is the new market research product that finally provides a way to talk with real, first-party consumer panel members who actually have been exposed to out-of-home advertising.

  • First you validate their exposure via advanced mobile geolocation.
  • Then you survey them to understand how well the OOH campaign has succeeded.
  • Ascertain their brand and product awareness versus an unexposed control group.
  • Learn whether they intend to buy.
  • Then track their subsequent location visits and send a survey after they’ve been to a store that carries the advertised product. Do they cite the billboard or other OOH signage when you ask why they bought a product?

Entertainment Industry (Have You Been Tricked?)

Halloween is synonymous with horror at the multiplex, but theater chains need to be sure their customers are experiencing movies as a treat. There has been no good way to get reliable data on how moviegoers view their experiences with concessions, lobby displays and on-screen advertising. To get people into those seats, film studios need to create effective trailers, and test them on the target audience for each film.

Now Here's Your Treat:

  • In-store and after-visit location studies put cinema owners in touch with validated moviegoers, for fast insights into their experience of the movie and of the theater’s amenities. If something’s not right on opening weekend, you’ll correct it by the next.
  • MFour is the acknowledged leader in mobile film-trailer and television episode testing.
  • Special smartphone technology enables entertainment clients to show clips or entire trailers on the same smartphones most consumers use to scout movies and decide which ones to see.
  • Security is crucial in trailer testing, and MFour’s system prevents respondents from downloading or sharing test images or video clips. In other words, no unauthorized spoilers.

Whether your research needs are in advertising effectiveness, shopper experience, or path to purchase, let’s talk about how mobile research solutions can satisfy your projects’ specific needs. Just click here.


Topics: mobile research, geolocation, market research, consumer insights, Halloween, in-store

Don't Underestimate what Mobile News Consumption Means to Market Research

Posted by MFour on Aug 23, 2018 7:00:00 AM

Blog mobile news 22Aiug18

Should the news that news consumption is overwhelmingly mobile matter to marketing pros and the market research industry? Should it matter to skiers whether there’s snow on the mountain?

For good reason, news organizations are scrambling to meet consumers on mobile, because that’s where news consumers have gone. Those who’ve been able to offer a great mobile product are gaining readership and revenue, while those who can’t seem to get mobile right continue to fade. Similarly, amid industry-wide malaise in market research caused by falling survey participation and crumbling data quality, it’s past time to go all-in with mobile data-collection and get it right. There’s simply no other way forward.

Pew Research Center’s most recent checkup on the state of news consumption underscores that it’s no longer news that mobile has taken over in nearly every phase of life. Skiers who are trying to stay upright during a downhill run may be among the few identifiable groups who are certain not to be using their smartphones at any moment. Or so one hopes.

As snow is to skiers, mobile is to the job of trying to understand consumers. It’s simply the medium in which information activity occurs. Without snow, there’s no skiing. Without mobile news publication, there’s no audience. Without mobile consumer data, there’s no way to understand consumers. And without a way to understand consumers, the news about market research and the businesses that depend on it for smart decision-making probably won’t be good.

Here are key data points from Pew’s study, which was conducted in 2017.

  • 58% of U.S. adults often consume news on mobile, compared to 39% on personal computers.
  • Mobile news consumption rose 176% from 2013 to 2017, compared to an 11% increase over the four years in news access via laptops and desktops.
  • Younger news audiences are even more heavily invested in mobile: 71% of 18- to 29-year-olds say they often get news on mobile, as do 67% of 30- to 49-year-olds.
  • In fact, among 17 demographic segments Pew focused on in its summary, spanning age, gender, race, income, education and political party, just one group, respondents over 65, said they most often used PCs rather than mobile to get the news.

To make a long story short, consumer insights pros and the decision-makers who depend on them for data they can trust need to focus on three key words: “GET MOBILE RIGHT.”

Start with that as your motivation, and we’ll help you get where you need to go. To set up a productive conversation about how to get mobile right as you seek solutions to your projects’ specific needs (including adding mobile to trackers), just click here.

Topics: mobile research, market research, consumer insights, data quality, surveys, consumer experience

Want Your Research To Be Great? Communicate!

Posted by MFour on Aug 21, 2018 8:27:20 AM

Blog Conversation 21Aug18 

Is it time to revise traditional industry identifiers such as “market research” and “consumer insights” (or as we call it "consumer understanding")?

It’s not that these phrases have outlasted their meaning. But at every turn, “communication” seems like it should be part of how we define our jobs. For starters, it’s crucial to communicate effectively with the consumers we’re trying to understand. If we can’t interest them and win their trust with a seamless, crystal clear survey experience, they’ll ignore us. Or, perhaps even worse, they’ll penalize poor communication by turning off their brains while they plow through a survey.

Attracting and hitting it off with the right consumers is just the start, however. Admirable data becomes useless if communication falters down the home stretch. There’s no payoff for a brilliant research project if the decision makers tune out because the presentation is confusing dull, and fails to anticipate the questions they really want answered. The presentation is like the ninth inning of a ballgame, when the team’s closer is called upon to hold a lead, clinch victory, and give value to everything that has come before.  

A recent online piece for Quirks by Chris Jesurun, manager of consumer and brand insights at Chicago-based Potbelly Sandwich Shop, offers sound advice on how to communicate down the home-stretch by presenting research findings in ways that are structured to maintain interest and answer anticipated questions.

A key takeaway is the need to communicate with the decision-makers to understand what they need to accomplish – not during the presentation, but at a much earlier stage in the project. To continue the baseball analogy, there’s no point calling in your closer when you’re behind, and conducting a market research project without understanding its purpose isn’t likely to enter the ninth with a win in sight.

There’s an additional stage in your research when communication is just as critical: when you’re having a discussion with research vendors about how to organize and execute a project. At MFour, we call the people you’ll have those discussions with “solutions executives,” because they want to plug you into the research products and methods that will help you and your clients or stakeholders solve business problems, not just data collection problems. The more you can communicate your business aims along with your technical needs, the better the results will be when it comes time for you to close with a winning presentation.

To kick off a great communication process leading to a great research project, just get in touch and we’ll have a productive conversation about how to meet your specific projects’ needs. Just click here.

Topics: market research, consumer insights, data analysis, data reporting

Inconveniencing Consumers Is a Killer for  Market Research, Too

Posted by MFour on Aug 15, 2018 12:22:17 PM

Blog Consumer Inconvenience 14Aug18

Here’s a consumer insight that retailers can etch in stone: if you don't make shopping easy and convenient, consumers will abandon you, and competitors who do it better will swoop in and grab them and their wallets for themselves.

A recent RetailDive mobile commerce newsletter gives further evidence that inconvenience is a killer. It reports a recent study by Splitit, a digital payments solutions company, in which  87% of online shoppers surveyed said they would abandon their shopping carts during checkout if the process was too difficult – with 55% saying they would never return.

Inconvenience also is a killer for consumer research, because consumer research is, in fact, a B2C sell. If this assertion surprises you, it’s time to take a broader view. 

Yes, consumer research is, of course, a B2B transaction between research suppliers and their clients. But what’s being supplied and bought is consumer data. And there will be no consumer data, or at least none worth having, if you fail to sell consumers on providing it in an engaged and thoughtful way. So before it can become a B2B offering, consumer research needs to be a B2C success. 

If you make it inconvenient for consumers to access research experiences and fail to make those experiences easy and enjoyable, you’ll end up with the equivalent of those abandoned online shopping carts – too few consumers, too little reliable data, and, eventually, not enough business to sustain your research enterprise. Unrepresentative data, insufficient data and unreliable data are certainly beyond-inconvenient to the ultimate consumers of consumer research: the business decision-makers who expect reliable guidance grounded in validated consumer reality.

MFour’s value proposition is quality mobile data made possible by an engaging, pain-free, and seamlessly convenient survey experience for the consumers who download our standard-setting mobile research app. More than 100,000 of our Surveys On The Go® (SOTG) app users have spoken for themselves about their experiences by posting comments and ratings in the Apple and Google Play app stores. SOTG perpetually enjoys an average rating of 4.5 stars out of 5.

Here are other metrics that reflect what our survey-app users' convenience and satisfaction have meant for MFour's clients:

  • 25% response rates within an hour, and 50% within one day.
  • 95% completion rates for surveys with LOI of 20+ minutes.
  • 85% participation in follow-up surveys for consumer diaries and other multi-phase studies.

The takeaway is that the people on our panel are not checked out from consumer research. To learn what that can mean for your specific research projects, just click here.


Topics: mobile research, consumer insights, data quality, retail, consumer experience

A 46% Surge at Staples? It Must Be Back-to-School Season.

Posted by MFour on Aug 9, 2018 12:03:32 PM

Blog P2P Back to School 8Aug18

Yes, it’s that time of year again, when many youngsters’ hearts sink a little under the knowledge that they’ll soon be Back to School, and many a consumer insights professional’s work day becomes more pressured (one hopes after having first recharged with a nice summer vacation)MFour’s Path-2-Purchase™ Platform has been observing shifts in retail trends critical for consumer insights professionals who need an immediate understanding of shopper behavior this time of year.

  • At Walmart, nationwide store visits over the first three weekends in August were up 17% over the last three weekends in July.
  • Target saw a 22% jump during the same period.
  • Staples stores witnessed a whopping 46% gain in average weekend visits, coinciding with the August Back-to-School season.

Back to School is a big event for retailers and brands. The National Research Federation predicts that this year's sconsumer spending will reach $83 billion by the time school bells ring and college campuses come back to life. It’s a short window from now ‘til then, and sellers must hustle to maximize their share. Hence the pressure on the consumer insights teams they're relying on for data, analysis and guidance.

Are you up to the challenge of helping your clients or your brands’ decision-makers recognize problems and opportunities right away? Being able to make on-the-fly adjustments is crucial to succeeding in todays complex and competitive retail environment.

One very applicable quick-turnaround use case for Path-2-Purchase™ from now until school starts can help your decision-makers right-size seasonal staffing. When you can see and quantify actual surges in traffic, you can put more customer service representatives and checkout personnel in your stores to give your shoppers an experience that they’ll consider efficient, successful and relatively stress-free. They’ll love you for it – and they’ll be back when Halloween comes around.

How does it work? A key value of  Path-2-Purchase™ is the ability to instantly identify consumers as they visit a store, and push them a mobile survey while they’re still shopping, or just after they’ve left. You get your data from validated, first-party consumers, segmented not just by where and when they shop, but by detailed demographic profiles based on more than 200 data points. It beats trying to infer who people are from third-party data whose uncertain sourcing often makes it too much of a not-so-good thing. And it lets you understand your competitors’ customers and their paths to purchase, in ways that can help your brand convert the other guy’s shoppers into your own.

Because you’ll identify and survey shoppers while they’re still in a store, or just after they’ve left, you’ll get feedback while their emotions and recall are at a revealing peak. Researchers can expect a 25% response rate within an hour, and 50% within 24 hours. Identifying shopper satisfaction issues in the first week or two of Back to School shopping gives you your best shot at helping your stakeholders correct them in time to avoid alienating shoppers and taking hits to the bottom line.

You can school yourself by taking a free spin with the Path-2-Purchase™ dashboard, so just click here. And to learn more about how first-party mobile consumers engaged with in-app mobile research capabilities can meet your specific projects’ needs, just click here.

Topics: mobile research, Path-2-Purchase™ Platform, consumer insights, back to school

Women of Insight: Meet MFour's Senior Research Consultants

Posted by MFour on Aug 2, 2018 9:20:14 AM

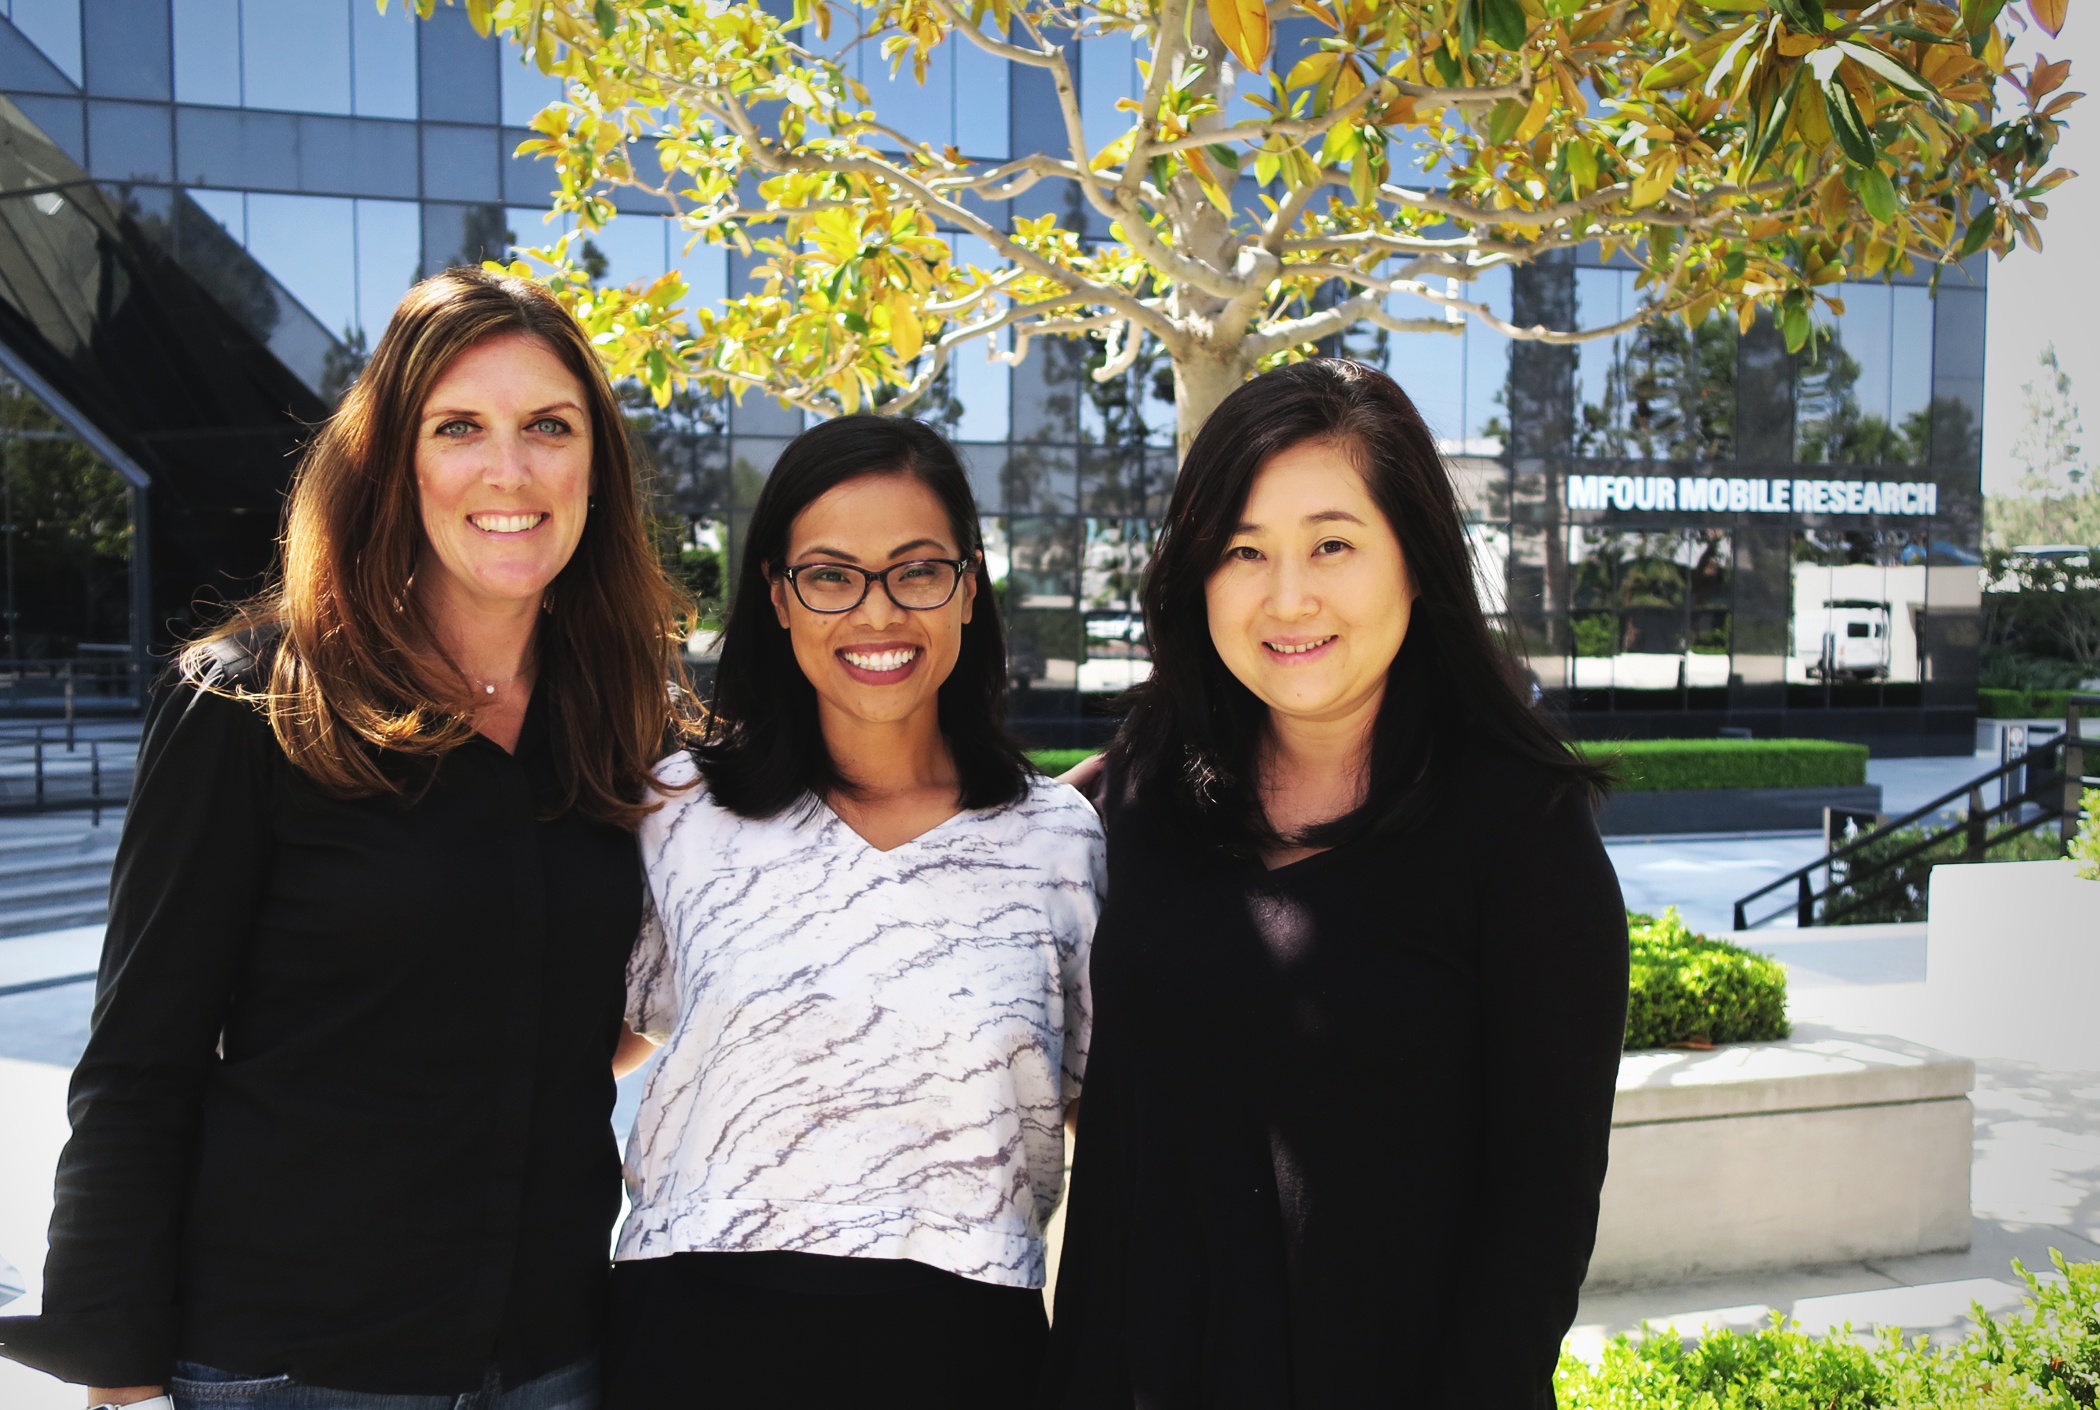
Quirks photo Wehn Martinez Han Aug 2018 issue

L-R: Allyson Wehn, Joan Martinez, Andrea Han

Successful market research delivers accurate, actionable numbers that reliably depict consumer reality, but success really depends on the human factor. At one end are the people who provide a window on reality by participating in research as respondents. At the other are the consumer insights professionals who have the expertise and passion to succeed at the meticulous, exacting work of creating studies that will obtain data that's pertinent and reliable, then interpret what it all means to give clients analysis and recommendations that will help them reach  smart business decisions.

It's only fitting, then, that three key members of MFour's insights team, Senior Research Consultants Andrea Han, Joan Martinez and Allyson Wehn, have a spotlight moment in the August issue of Quirk's, as part of its "Faces of Market Research" feature. You can check out their profile in the magazine itself by clicking here (see pg. 57). Or just read on.

Andrea Han, Joan Martinez and Allyson Wehn have come from widely diverse hometowns – Sao Paulo, Brazil, the village of Ordot on Guam, and Fullerton, CA., respectively -- to share a proud and important job title at MFour: Senior Research Consultant. They also share a passion for consumer insights that, among them, has produced 57 years’ experience in market research. As a team, they analyze data obtained from validated, first-party consumers who participate in research by using MFour’s pioneering mobile app, Surveys on the Go®. That includes drawing insights from location tracking data, photo captures, and real-time “video selfies” that respondents create and submit with their phones.

“My natural curiosity has driven my career,” says Martinez, who has been doing consumer research since her college days at California State University, Los Angeles. “What intrigues me about MFour is the technology. My thinking was, `this is the new frontier, where the world is going.’ I want to be part of that.”

For Wehn, “sometimes I feel like a detective, because clients are asking me to look for answers.” The University of California, Santa Barbara graduate also relishes the populist underpinnings of consumer research. When she’s out shopping, she often finds herself mentally recreating the research behind the merchandise. “When I see the real-life applications, more often than not those decisions come from consumers giving feedback on how they want things to be.”

Han, a graduate of the University of Southern California, says her career satisfaction is tied to her clients’ satisfaction. “They want to know, `what does this data mean to us?’ That’s what we’re here for. The real rewarding part for me is when clients look at the insights in the deck and say, `this is what we needed…and more.’”

You, too, can get what you need...and more. Get in touch and we'll talk about getting you started. Just click here.


Topics: mobile research, market research, consumer insights, data quality, data analysis

The Best Screener Qs Are The Ones You Don't Even Have To Ask

Posted by MFour on Jul 31, 2018 9:30:00 AM

Question Mark 2 blog 30July18 

Louis Armstrong, whose 117th birthday falls this week (Aug. 4), is one of the most recognizable and enduring personal brands in popular culture. But one of his most famous sayings seems to contradict the very concept of market research’s role in building brands.

“If you have to ask, you’ll never know,” the brilliant trumpeter (and singer of the hits “Hello, Dolly,” “When the Saints Go Marching In,” and “What a Wonderful World”) replied, when asked to define “swing,” the term for the freewheeling jazz rhythm he pioneered.

But now Satchmo’s saying is beginning to make more sense in consumer insights terms, thanks to Path-2-Purchase™ Platform. This transformative new visualization tool lets you obtain a wealth of data about a representative, first-party consumer panel, without even having to ask. The result is faster, far more precise segmentation of the people you most need to talk to, and, when you do start asking questions, a leaner, more efficient survey process.  

Path-2-Purchase™ lets you eliminate most of the screener questions that bog down your research and cost you time in filling quotas and fielding your questionnaires. Now respondents  don’t have to go away frustrated and alienated from the research process because they were screened out. That keeps  them very much alive as participants for all your future projects. Meanwhile, consumers who do qualify get right to the point because they only have to answer the truly substantive questions that focus on what you really need to know. Research becomes much faster. Engagement intensifies. Data quality attains new heights. And so does the level of assurance with which you can present your findings and recommendations to your clients or stakeholders.

Take a look and play with Path-2-Purchase™ by clicking here. You’ll get a quick understanding of its potential for segmenting, targeting, surveying, and mining historical data from the consumers you most need to know.

  • You’ll select among 2.3 million first-party validated consumers, based on their journeys across 12.5 million U.S. locations.
  • No need to ask where they’ve been and trust their recall.
  • You’ll also know them by more than 200 first-party demographic and psychographic profiling characteristics, enabling you to select validated, relevant consumers to interview without having to ask numerous screener questions.
  • When you are ready to ask, you can reach them at any time and place.
  • To acquire deep context for your survey data, simply append historical location, profile and survey data from our Consumer Knowledge Center.

So take a few moments to explore what a wonderful world it could be if you jump on board to select, track and gain unprecedented contextual understanding without even having to ask. Set up a live demo and conversation about how Path-2-Purchase™ can help you fulfill your projects’ specific needs faster and more efficiently than ever before, just by clicking here.

Meanwhile, Happy Birthday to Louis Armstrong, who is now at least half right about market research. Here’s something swinging from the man himself.


Topics: mobile surveys, market research, survey, Path-2-Purchase™ Platform, consumer insights, survey design

It's a War Out There: Consumer Insights and the Battle for QSR Pizza Market Share

Posted by MFour on Jul 27, 2018 7:00:00 AM

 Pizza Blog 26July18

From a business perspective, a key ingredient for success in the battle for market share in quick-serve pizza delivery and carryout is validated consumer insights from real pizza buyers.

The war for the pizza consumer’s wallet is extremely hard-fought, the latest evidence being Domino’s announcement that it aims to open 2,350 additional stores in the U.S. over the next ten years – a 42% increase from the 5,650 locations it already has. Now that’s an ambitious example of a business trying to increase its deliverables. Right now, however, Pizza Hut is in the lead, with 7,469 U.S. stores at the start of 2018.

Fast delivery is not the only thing QSR pizza brands must deliver. They need excellent counter service, too. Domino’s for example, realized 63% of its $26.5 billion in 2017 U.S. sales from carryout business, per its most recent annual report.

From a marketing and consumer insights perspective, Domino’s, Pizza Hut, and every other QSR pizza or fast-casual pizza chain has at least one thing in common: it’s easy to find out who’s going to each brand’s stores for carryout or dining in, and how much traffic each chain is getting, down to individual stores. You just have to know about MFour’s Path-2-Purchase™ Platform, which you can do by clicking right here.

Important consumer panel facts and mobile research capabilities include:

  • 2 million validated, demographically-profiled real consumers who have downloaded the Surveys On The Go® mobile research app.
  • Store-level accuracy with GPS location tech that tracks and validates each research participant’s store visits across 12.5 million U.S. retail and restaurant locations (including all stores of the top 1,000 retailers, with all the big pizza players represented).
  • Identify key consumer segments to understand the “who” behind those location visits – segment by age, sex, income or whatever else you need, with 250 demographic and ethnographic profiling characteristics.
  • Add the “where” of consumer behavior by observing real, first-party participants’ visits to store locations in a specific zip code, in a DMA, a state, or nationwide.
  • Understand the “when” and the “how often” by observing visit frequency (indicating who’s a brand loyalist, agnostic, or rejector), time of day, day of week, and dwell-time.
  • Crucially, get insights into the “why,” by surveying GeoValidated® consumers after they’ve left a store. Expect a 25% response rate within an hour, 50% within 24 hours.
  • Get competitive insights by identifying, tracking and surveying a rival’s customers.

There’s a lot more – for example, we can help you find and survey pizza delivery workers, too. And another Domino’s initiative, delivering to 200,000 outdoor locations nationwide, such as beaches and parks, can be observed and studied too, via custom geolocation research that captures visits to any place in the U.S. for which you know the latitude and longitude. You can set up a productive personal demo on how to find, reach out to and understand the real consumers most important to your specific research projects and objectives, just by clicking here.


Topics: geolocation, market research, Path-2-Purchase™ Platform, consumer insights, QSR, competitive insights

Were Advertising ROI Metrics Better in 2000 BC than They Are Today?

Posted by MFour on Jul 26, 2018 7:00:00 AM

 Ancient Pottery Blog 25July18

Trying to measure advertising ROI occupies the workdays (and perhaps some sleepless nights) of Chief Marketing Officers, brand managers and consumer insights specialists the world over. The problem is that advertising ROI as it’s commonly measured might as well stand for Really Only Inferences. In the absence of real data from real consumers, measurement quickly becomes supposition.

Things were so much better 4,000 years ago. That’s when the first marketers began branding products and measuring the impact on sales. And they had the benefit of using real data from real consumers to measure the return on their branding efforts.

According to scholarship published in the Journal of Macromarketing, if a friend invited you over to dinner during the Shang Dynasty in China (2000-1500 BC), chances are you’d be served from pottery marked with symbols unique to its maker, who was also its marketer. And if you admired your host’s serving bowls, the symbol on them would surely catch your eye and prompt you to ask who made them. And that would be the first step toward product awareness, intent to purchase, and, eventually, to a sale. The maker’s investment of time and effort in festooning bowls with branding symbols would have earned a nice return.

That ancient Chinese potter had a huge advantage over many 21st Century marketing, advertising and consumer insights professionals when it came to understanding ROI. The potter could engage each actual buyer in person, and understand exactly what motivated each purchase. 

Now the direct connection to feedback from actual consumers largely has vanished. In attempting to measure ROI for Out of Home advertising, for example, today’s marketing and insights professionals are forced to fall back on inferences from data that may be tangential or even irrelevant to the actual purchase.

For example, one common but flawed method for measuring ROI is to make estimates based on raw traffic counts. The assumption is that people who passed by a highway billboard or another form of OOH advertising were in fact aware of the sign, the brand and the product. And that the sign played a significant part in driving them to shop and buy. That’s a lot to assume.

Another method, more grounded in today’s technology, uses mobile geolocation to determine that a particular consumer’s smartphone (and therefore its owner) passed in view of a sign, and subsequently was geolocated at a store carrying the advertised product. Third-party data such as apps detected on that consumer’s smartphone also might enter the mix as another input for spitting out inferred ROI metrics. Still, what’s missing from that algorithmic equation is the reality obtainable only from known and validated consumers. 

Here’s what’s often assumed or inferred in today’s standard methods for estimating advertising ROI:

  • That an OOH ad helped cause a store visit, rather than merely correlating with it.
  • That knowing which apps a consumer has downloaded is sufficient for making accurate inferences about who that consumer is. For example, whether he or she is a he or a she, and belongs to a consumer segment the OOH campaign is meant to target.
  • That an upswing in sales of the advertised product during or just after the campaign is by itself a trustworthy indicator that the campaign was a key driver of the added revenue.
  • For example, a sunblock brand may fly off the shelves during an OOH campaign, but the real driver could be a heatwave, rather than the advertising.

So what should marketers and researchers do to recapture the advantages Chinese artisans of 2000 BC enjoyed when it came to getting real marketing and advertising ROI metrics from real people?

The answer begins with identifying and surveying real consumers who’ve had validated exposure to an OOH campaign. As for the rest, it will cost you a click to find out – so just click here.

Topics: market research, consumer insights, ad measurement, digital advertising, out of home advertising

Subscribe to Email Updates

Recent Posts