MFour

Recent Posts

Here's Why Respondents Drop  "Mobile First" Surveys

Posted by MFour on Apr 12, 2018 10:10:00 AM


Stopwatch 10Apr18

Mobile survey engagement is won or lost in a fraction of a second – a time span shorter than it takes to say “mobile survey engagement.” 

The time span we’re talking about is the gap that occurs between screen taps as a respondent proceeds through a smartphone survey.

The questionnaire that hesitates for just a third of a second or more is lost, according to research from Google.

"Mobile first” or “mobile optimized” surveys will regularly fail the speed test. The user experience starts badly due to slow load times, and goes downhill from there. Engagement erodes, and data quality erodes with it. And its likely that these frustrated consumer won't want to take any more surveys, exacerbating the panel recruitment problem that already plagues online research. The solution is to reach mobile consumers offline via a smartphone app.

The proven answer is MFour's  Surveys On The Go® app. Introduced in 2011, at the dawn of mobile research, SOTG has attracted the world's largest, most engaged all-mobile consumer research panel. More than 2 million U.S. users have downloaded it, and their satisfaction and engagement can be measured by the 4.5 stars out of 5 rating the app consistently receives in unsolicited public ratings and reviews left at the Apple and Google Plus app stores. If respondents' mobile app survey experiences were slow, they wouldn't be so pleased, and the number of consumers downloading it wouldn't be growing by more than 2,000 per day, strictly by word-of-mouth.


"Mobile first" surveys fail the speed test because they don't take place inside an app. They merely shoehorn conventional online surveys onto smartphone screens. Also referred to as “mobile optimized” or “mobile web” surveys, they require an uninterrupted connection between phones and websites, and the risk of disengagement or dropped surveys increases with each question. That's because the "mobile first" process resembles a  game of ping-pong. Each question goes ping as it’s loaded into consumers' phones, and then pong, when they send their answers and try to move on to the next question. This back-and-forth volleying continues until the questionnaire is completed. It adds up to 40 chances for delays in receiving questions and sending answers over the course of a 20-question survey. 

According to Google, if any part of an online exchange takes more than a 20th of a second, “the connection between action and reaction is broken."

Here are a few more observations from Google’s analysis of what happens when mobile consumers are forced to wait:

  • “When it comes to negative mobile interactions, one of the top complaints we heard is “slow interactions.”
  • “Making speed a priority is critical…53% of mobile site visits are abandoned if pages take more than 3 seconds to load.”
  • “46% of people say they would not purchase from a brand again if they have an interruptive mobile experience” (think of the survey-taking experience as market research's own consumer satisfaction challenge).

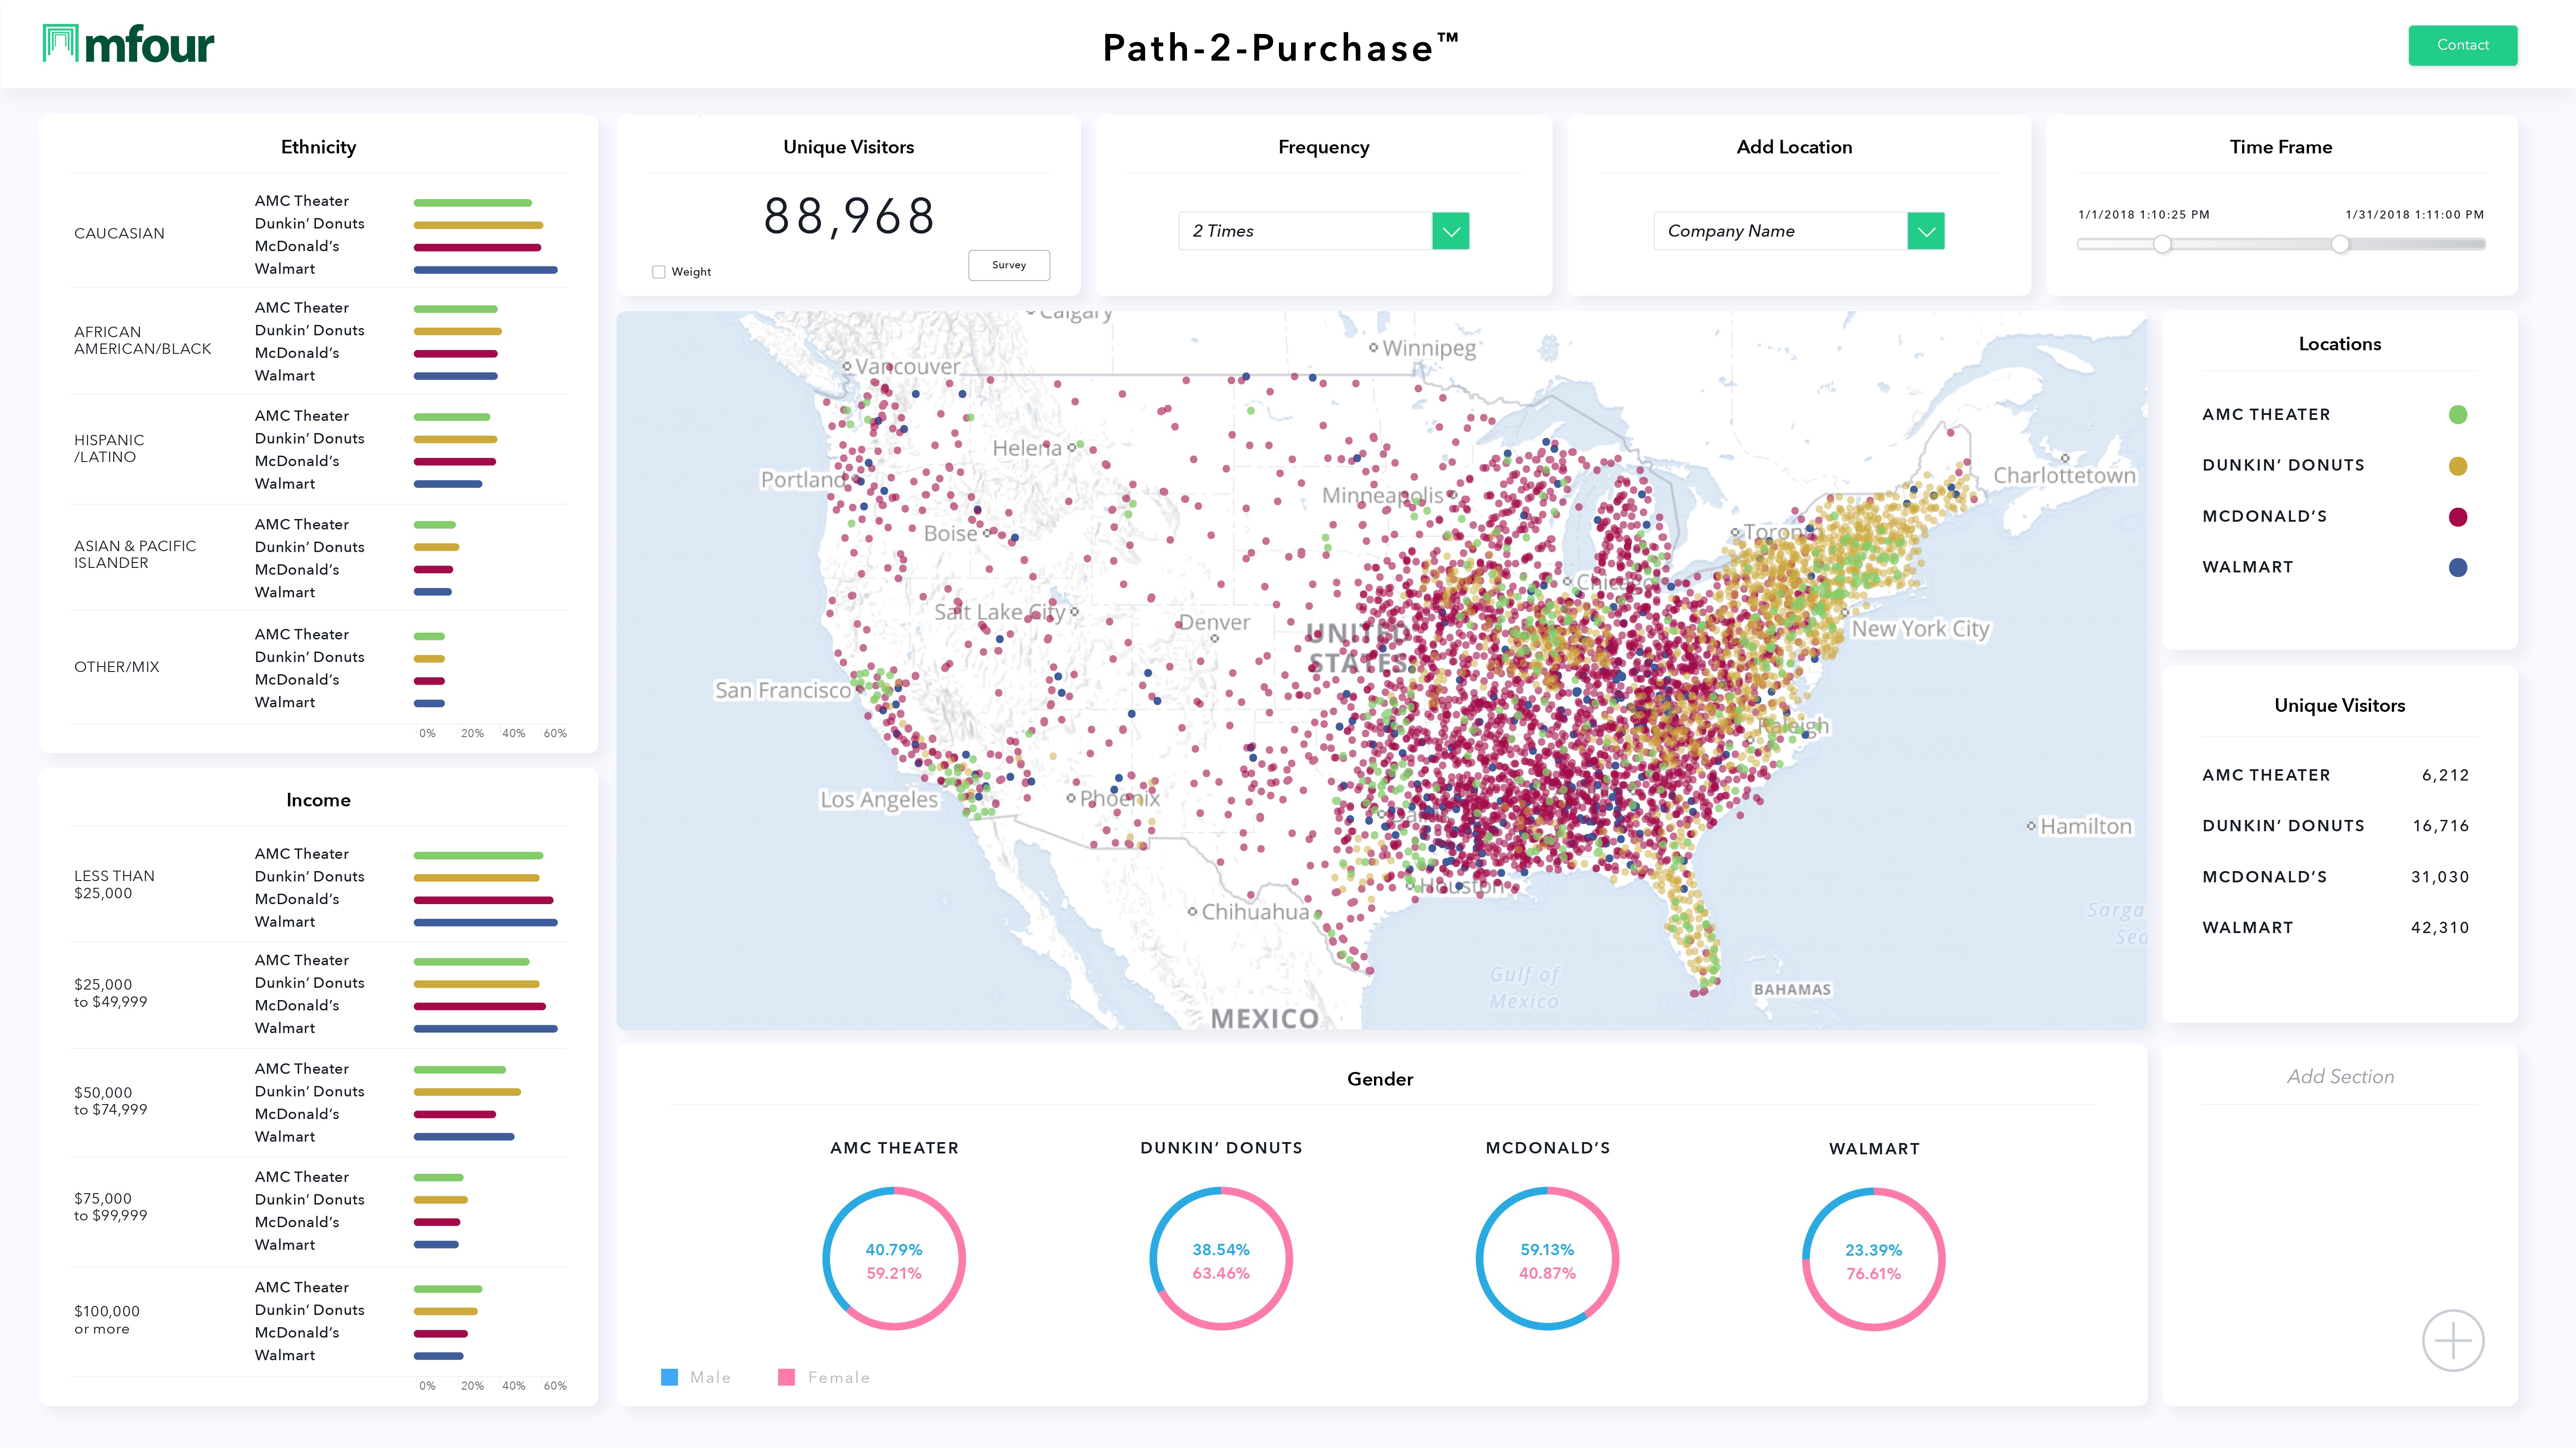
Whether it’s a quick-hit, fast-turnaround study on MFourDIY®, the only all-mobile DIY platform, or a project powered by the unprecedented location tracking, targeting and segmenting now available to users of the new Path-2-Purchase™ Platform, it all begins with what’s happening under the hood. If you give your research audience the opportunity to respond via Surveys On The Go®  app, you're giving them the superb smartphone experience they expect and appreciate. And they'll reward you with the engaged attention that leads to quality data and insights that will support business recommendations you can stand behind.

For a conversation and a demo on how MFour delivers validated consumer understanding for all, just get in touch by clicking here.


Topics: mobile research, mobile apps, Path-2-Purchase™ Platform

What’s Wrong with this Survey?

Posted by MFour on Apr 11, 2018 9:55:28 AM

Pictured: Path-2-Purchase™ Platform dashboardP2P_Dashboard_widescreen_update_Final

Below is a hypothetical customer satisfaction survey for a casual dining restaurant chain. It looks like a lot of standard surveys that are regularly fielded, but in fact the design is woefully outdated. We’ll tell you why, and what you can do about it.

First, take a look and ask yourself which questions you wish you could replace or eliminate, because you know the data will be compromised by recall bias and other issues that beset stated response questionnaires.

Q1: Have you been to [restaurant chain name] in the past 14 days?

Q2: Please give the location of the restaurant, by city and, if possible, the district or street.

Q3: How often do you eat at a [chain name] restaurant?

Q4: Did you eat at any of these other restaurants during the past 14 days? [showing a list of four competing chains]

Q5: How often do you eat at [the competitors’ restaurants]?

Q6 – Q13: [a series of customer satisfaction and net promoter score questions about the respondent’s most recent visit to the client’s restaurant.]

Q14-Q21: [Identical customer satisfaction questions about the most recent visit to a competitor’s restaurant.]

It’s the first five questions that are problematic. The inadequacy of Q1 to Q5 compromises the reliability of the remainder of the survey, because stated answers about visitation over time just aren’t very trustworthy. Do you remember which restaurants you visited over the past two weeks? Do you still have a strong impression and an accurate, specific recall of the experience, including what you ordered and how friendly and efficient your server was? How satisfied or dissatisfied you were – and why?

So how do you avoid compromising your data about consumer experience and consumer satisfaction? Instead of asking problematic questions about who, where, when and how often, businesses can leverage the groundbreaking Path-2-Purchase™ Platform and see at a glance where real, validated consumers have gone, hour by hour, day by day, across 12.5 million U.S. locations, including all locations of the top 1,000 retailers. Here’s some of what Path-2-Purchase™ delivers:

  • Archived, comprehensive location and visitation data that lets you identify brand loyalists and brand rejectors before you’ve even started.
  • Survey targeting based on locations, visits and detailed, validated profiles of the industry’s largest proprietary, all-mobile consumer panel.
  • The ability to field in-store or after-visit surveys that all but eliminate recall bias.
  • “Why” answers you can trust because you’ve asked them at the Point-of-Emotion® where decisions and experiences are vividly in your respondents’ minds.
  • Validation by photo capture of purchase receipts or other identifying images.
  • Vivid, in-their-own words insights from “video selfies” you can ask respondents to make about a dining or shopping or product-use experience, while it’s happening or just after the event.

In short, Path-2-Purchase™ gives you a big head start without even having to ask “who,” “when,” “where” and “how often.” You can focus confidently on the crucial “why,” knowing you’ll get data from the right respondents, with recall bias neutralized. It’s accurate, efficient, and simply better, because it’s categorically different from stated-answer surveys taken by poorly validated, multi-sourced panelists.

To set up a one-on-one demo about how Path-2-Purchase™ Platform delivers validated consumer insights for everyone, just click here.

Topics: mobile surveys, path-2-purchase, Path-2-Purchase™ Platform

Why Online Researchers Should Be Afraid of Children

Posted by MFour on Aug 21, 2017 9:28:55 AM


Blog Scary Kid


Who’s your favorite scary kid? Billy Mumy’s classic turn in the “Twilight Zone” episode “It’s a Good Life” gets our vote. Linda Blair’s bravura demon-possession turn in “The Exorcist” bears careful consideration. Damien in “The Omen?” Also a candidate. And those ghostly twin girls in “The Shining” are guaranteed to give you the creeps.

Whether they realize it or not, fear of the young will be coming in waves for online research providers and their clients who depend on people taking surveys on desktop and laptop computers. Gen Z, which makes up 26% of all Americans, is rising fast as a consumer force, and how this youthful horde relates to personal computers should scare online researchers out of their wits.

For sellers and buyers of online sample and technology, Nielsen’s Total Audience Report for the first quarter of 2017 reads like something out of H.P. Lovecraft or Stephen King. The average member of Gen Z – ages 2 to 20 in the Nielsen study – spent 8 minutes a day going online with personal computers. Only 19% of the Z-ers connected to the internet with a PC even once a week. This represents a huge generational chasm, even though older generations also decisively prefer mobile to PCs.

  • Millennials and Baby Boomers each averaged 62 minutes a day online via desktops or laptops. For Gen X members, it was 82 minutes a day.
  • Conversely, the average Millennial spent 171 minutes a day using a smartphone and 34 minutes using a tablet -- totaling 3 hours and 25 minutes of mobile digital access per day. That’s more than three times the PC-online connectivity Millennials had on personal computers. Only 50% of Millennials used a PC once a week or more to connect online.
  • Gen X members spent 156 minutes on smartphones and 46 on tablets, for 3 hours and 22 minutes of average mobile connectivity per day. 42% did not use a PC even once a week to make connections.
  • Baby Boomers also are fully on board with mobile: 149 minutes of digital access on smartphones and 36 minutes on tablets, for a total of 3 hours and 5 minutes a day – triple the time spent on personal computers. 44% of Boomers didn't manage a weekly connection via PC. 
  • African Americans and Hispanics remain particularly invested in smartphones – 177 minutes a day for African American Millennials and 193 minutes for Hispanics, putting them 3.5% and 12.9%, respectively, above the generational average.
  • Comparing Q1 2017 to Q1 2016, mobile usage has skyrocketed across generations. Millennials’ average daily time on mobile was up 52 minutes a day (a 34% increase) and the gains were 61 minutes (43.3%) for Gen X and a whopping 80 minutes (76.2%) for Boomers.

Nielsen didn’t measure Gen Z’s mobile use because of youth privacy restrictions, but you can safely assume that when it comes to mobile, they’re all-in. The oldest members of Gen Z were just 10 when iOS and Android smartphones came out. Most youngsters won’t remember a world without smartphones.

As we said, these are scary times for online research, and it’s only going to get worse. But there’s still plenty of hope. Knowledge and understanding will overcome fear, and you can start reducing your fear factor immediately by learning more about mobile research. For starters, you’ll need information to make an intelligent choice between in-app mobile solutions that are unique to smartphones and tablets, and “mobile optimized” methods that merely shoehorn online surveys onto smaller screens. For a productive, scare-free conversation, just get in touch at solutions@mfour.com.

And for a quick, entertaining video introduction to in-app mobile, just click here.


Topics: MFour Blog

Mobile 101: Why Native App Technology Beats "Mobile-Optimized"

Posted by MFour on Jul 17, 2017 9:30:53 AM


mobile 101


You may have heard the story of the football coach who decided his team needed to get back to fundamentals, so he gathered all the players and began at the beginning: “This is a football.”

Today’s Mobile 101 installment is about the fundamental of all fundamentals, beginning at the beginning: “This is a native app.”

Dictionary.com defines “native” as “natural, hereditary, connected with something in a natural way.” So a “native app” is one whose natural and sole environment is a smartphone. It’s been created strictly with smartphones in mind, and designed to give perfect performance on a phone.

Researchers who use mobile have to choose between going with native app survey technology or a “mobile optimized” approach that ignores the smartphone’s own native environment and takes place in the same online space as traditional surveys designed for desktops and laptops.

By going the native app route, you get mobile-specific technology that loads your entire survey instantly into respondents’ phones, enabling them to answer without a connection to the internet. It’s like downloading a gaming app and proceeding to enjoy it without interruption because of the app’s fast-twitch functionality.

Researchers who choose “mobile optimized” over native app are asking their respondents to use their phones like ping-pong paddles. It's not exactly an efficient way to harness one of the most powerful consumer technologies ever devised.

  • Mobile optimized surveys don’t load into respondents’ phones. Instead, they depend on users clicking on email notifications to connect with the web page where the survey is housed.
  • Questions are served from the web to the phone one-by-one, and respondents volley their answers back, one-by-one. This back-and-forth continues until the questionnaire is complete.
  • Each volley can fail if the internet connection vanishes or slows. The predictable result is frustration, dropped attempts, and inattentive responses.
  • Surveys take longer, completion rates are lower, and consumers’ overall engagement with survey-taking suffers.

These are the fundamentals of today’s research game. Choosing the right mobile method is up to you – and you need to remember that in-app surveys aren’t just a little different, but different in kind from other mobile approaches. For more information about in-app mobile panel and technology, just contact us at solutions@mfour.com.


Topics: mobile technology, MFour Blog, mobile app, in-app Mobile surveys, mobile web, mobile optimized

Subscribe to Email Updates

Recent Posts